Immigrants from Norway vs Scottish In Labor Force | Age 20-64
COMPARE
Immigrants from Norway
Scottish
In Labor Force | Age 20-64
In Labor Force | Age 20-64 Comparison
Immigrants from Norway
Scottish
79.2%
IN LABOR FORCE | AGE 20-64
12.0/ 100
METRIC RATING
215th/ 347
METRIC RANK
78.9%
IN LABOR FORCE | AGE 20-64
1.3/ 100
METRIC RATING
245th/ 347
METRIC RANK
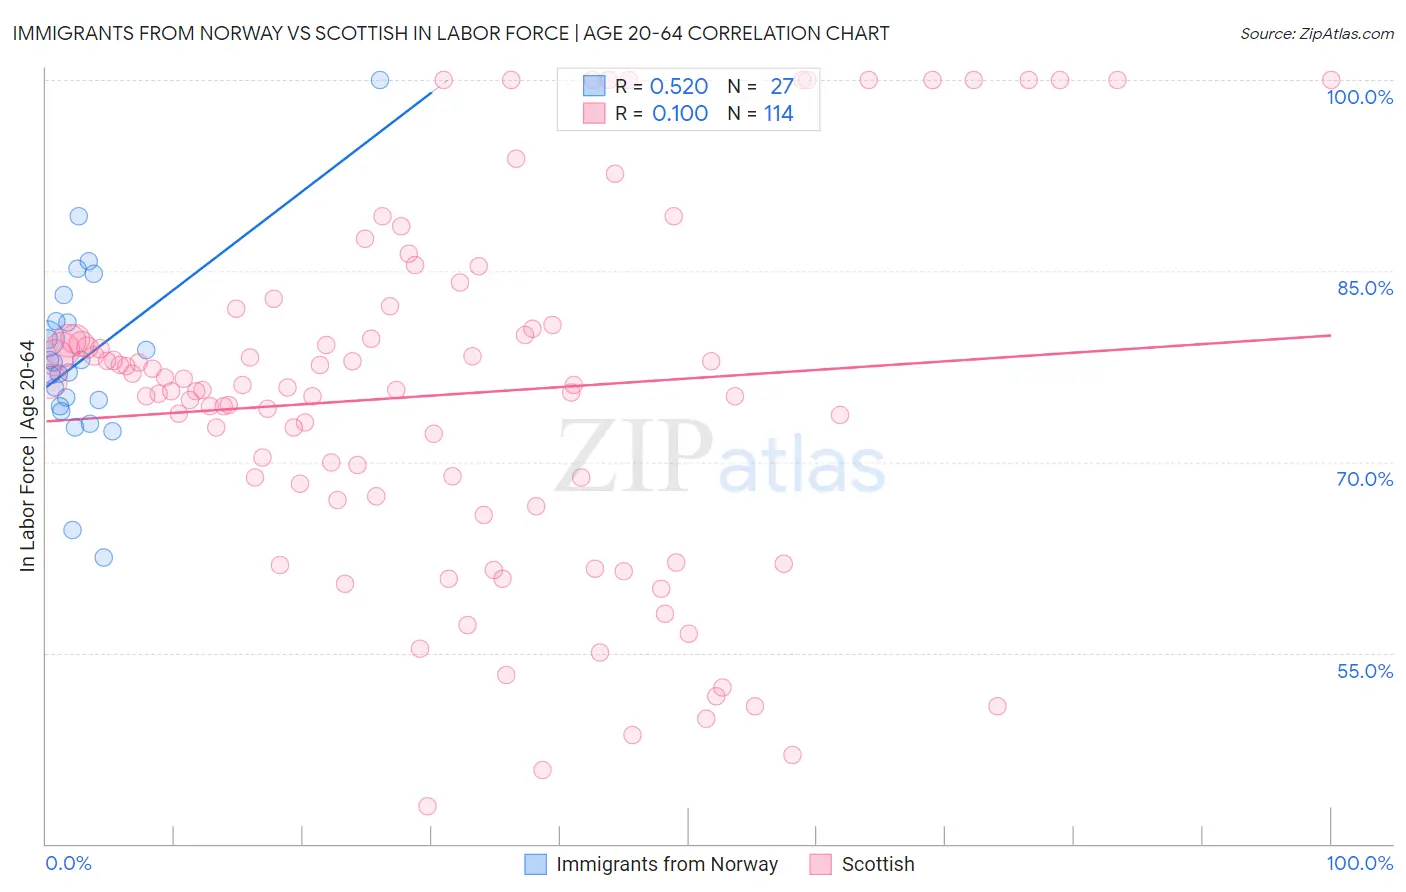
Immigrants from Norway vs Scottish In Labor Force | Age 20-64 Correlation Chart
The statistical analysis conducted on geographies consisting of 116,716,898 people shows a substantial positive correlation between the proportion of Immigrants from Norway and labor force participation rate among population between the ages 20 and 64 in the United States with a correlation coefficient (R) of 0.520 and weighted average of 79.2%. Similarly, the statistical analysis conducted on geographies consisting of 567,150,822 people shows a poor positive correlation between the proportion of Scottish and labor force participation rate among population between the ages 20 and 64 in the United States with a correlation coefficient (R) of 0.100 and weighted average of 78.9%, a difference of 0.48%.
In Labor Force | Age 20-64 Correlation Summary
| Measurement | Immigrants from Norway | Scottish |
| Minimum | 62.5% | 42.9% |
| Maximum | 100.0% | 100.0% |
| Range | 37.5% | 57.1% |
| Mean | 78.2% | 75.3% |
| Median | 77.8% | 75.9% |
| Interquartile 25% (IQ1) | 74.3% | 67.3% |
| Interquartile 75% (IQ3) | 81.1% | 80.4% |
| Interquartile Range (IQR) | 6.7% | 13.2% |
| Standard Deviation (Sample) | 7.3% | 13.9% |
| Standard Deviation (Population) | 7.1% | 13.9% |
Similar Demographics by In Labor Force | Age 20-64
Demographics Similar to Immigrants from Norway by In Labor Force | Age 20-64
In terms of in labor force | age 20-64, the demographic groups most similar to Immigrants from Norway are Immigrants from Armenia (79.2%, a difference of 0.0%), Arab (79.2%, a difference of 0.010%), Irish (79.3%, a difference of 0.020%), Immigrants from Portugal (79.3%, a difference of 0.020%), and Immigrants from Western Asia (79.2%, a difference of 0.020%).
| Demographics | Rating | Rank | In Labor Force | Age 20-64 |
| British | 16.5 /100 | #208 | Poor 79.3% |
| Bangladeshis | 16.4 /100 | #209 | Poor 79.3% |
| Haitians | 16.1 /100 | #210 | Poor 79.3% |
| Europeans | 15.3 /100 | #211 | Poor 79.3% |
| Irish | 13.2 /100 | #212 | Poor 79.3% |
| Immigrants | Portugal | 12.8 /100 | #213 | Poor 79.3% |
| Immigrants | Armenia | 12.2 /100 | #214 | Poor 79.2% |
| Immigrants | Norway | 12.0 /100 | #215 | Poor 79.2% |
| Arabs | 11.4 /100 | #216 | Poor 79.2% |
| Immigrants | Western Asia | 11.0 /100 | #217 | Poor 79.2% |
| Immigrants | England | 9.3 /100 | #218 | Tragic 79.2% |
| French Canadians | 8.4 /100 | #219 | Tragic 79.2% |
| Immigrants | Immigrants | 7.7 /100 | #220 | Tragic 79.2% |
| Hungarians | 7.2 /100 | #221 | Tragic 79.2% |
| Immigrants | Panama | 6.9 /100 | #222 | Tragic 79.1% |
Demographics Similar to Scottish by In Labor Force | Age 20-64
In terms of in labor force | age 20-64, the demographic groups most similar to Scottish are Immigrants from Trinidad and Tobago (78.8%, a difference of 0.030%), French (78.9%, a difference of 0.040%), Immigrants from Germany (78.8%, a difference of 0.040%), Immigrants from Caribbean (78.8%, a difference of 0.050%), and Immigrants from West Indies (78.9%, a difference of 0.070%).
| Demographics | Rating | Rank | In Labor Force | Age 20-64 |
| Immigrants | Jamaica | 2.6 /100 | #238 | Tragic 79.0% |
| Welsh | 2.4 /100 | #239 | Tragic 79.0% |
| Trinidadians and Tobagonians | 2.3 /100 | #240 | Tragic 79.0% |
| Jamaicans | 2.0 /100 | #241 | Tragic 78.9% |
| Immigrants | Micronesia | 1.9 /100 | #242 | Tragic 78.9% |
| Immigrants | West Indies | 1.7 /100 | #243 | Tragic 78.9% |
| French | 1.5 /100 | #244 | Tragic 78.9% |
| Scottish | 1.3 /100 | #245 | Tragic 78.9% |
| Immigrants | Trinidad and Tobago | 1.1 /100 | #246 | Tragic 78.8% |
| Immigrants | Germany | 1.0 /100 | #247 | Tragic 78.8% |
| Immigrants | Caribbean | 1.0 /100 | #248 | Tragic 78.8% |
| English | 0.9 /100 | #249 | Tragic 78.8% |
| Hondurans | 0.8 /100 | #250 | Tragic 78.8% |
| Barbadians | 0.7 /100 | #251 | Tragic 78.8% |
| Immigrants | Honduras | 0.6 /100 | #252 | Tragic 78.7% |