Immigrants from Nicaragua vs Northern European Poverty
COMPARE
Immigrants from Nicaragua
Northern European
Poverty
Poverty Comparison
Immigrants from Nicaragua
Northern Europeans
14.3%
POVERTY
0.1/ 100
METRIC RATING
259th/ 347
METRIC RANK
11.4%
POVERTY
96.0/ 100
METRIC RATING
87th/ 347
METRIC RANK
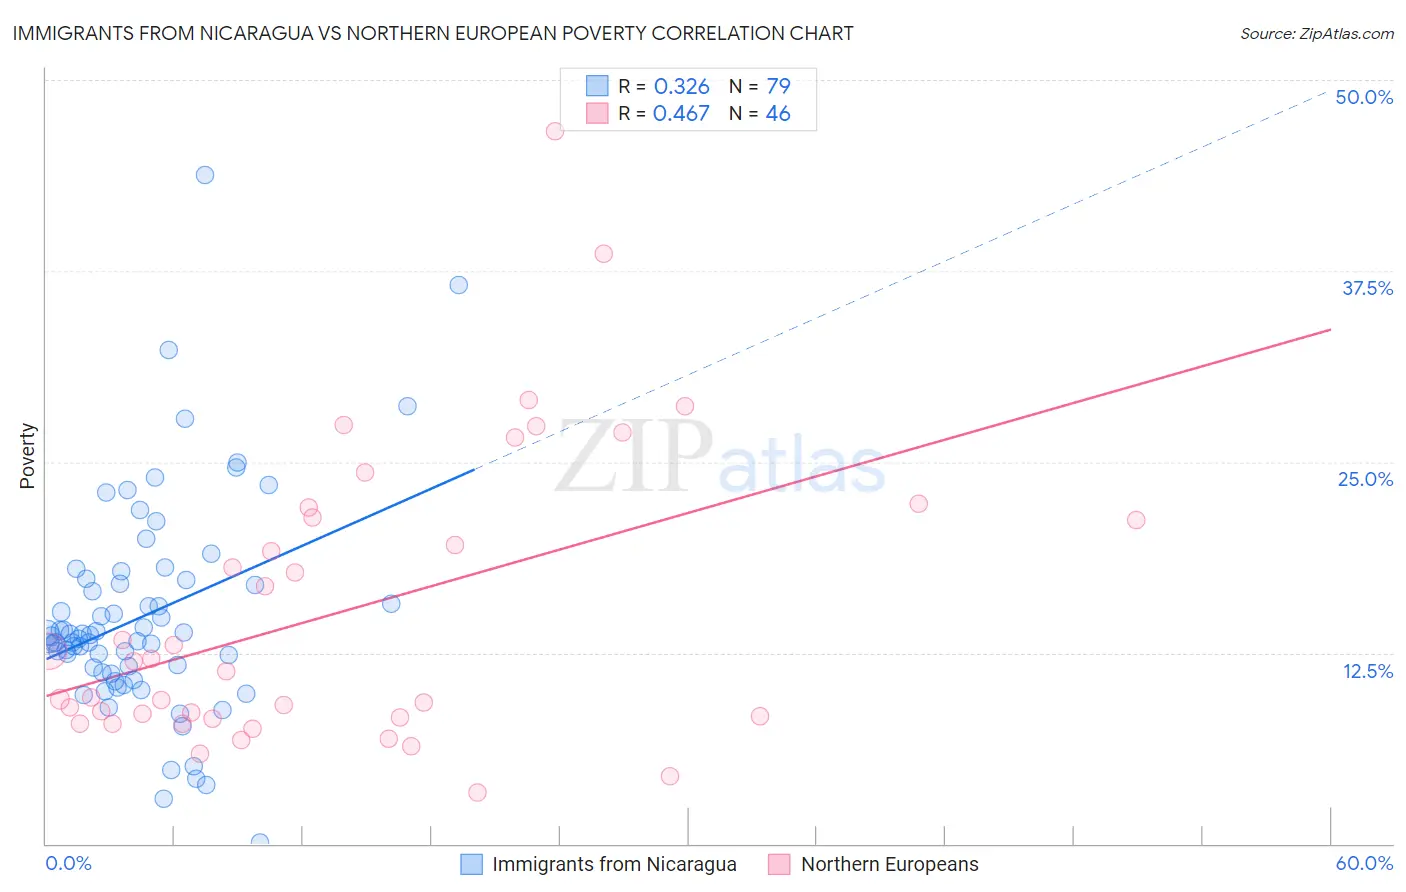
Immigrants from Nicaragua vs Northern European Poverty Correlation Chart
The statistical analysis conducted on geographies consisting of 236,320,114 people shows a mild positive correlation between the proportion of Immigrants from Nicaragua and poverty level in the United States with a correlation coefficient (R) of 0.326 and weighted average of 14.3%. Similarly, the statistical analysis conducted on geographies consisting of 405,898,980 people shows a moderate positive correlation between the proportion of Northern Europeans and poverty level in the United States with a correlation coefficient (R) of 0.467 and weighted average of 11.4%, a difference of 26.1%.
Poverty Correlation Summary
| Measurement | Immigrants from Nicaragua | Northern European |
| Minimum | 0.098% | 3.3% |
| Maximum | 43.8% | 46.6% |
| Range | 43.7% | 43.3% |
| Mean | 14.9% | 15.2% |
| Median | 13.6% | 11.6% |
| Interquartile 25% (IQ1) | 11.2% | 8.3% |
| Interquartile 75% (IQ3) | 17.3% | 21.4% |
| Interquartile Range (IQR) | 6.1% | 13.1% |
| Standard Deviation (Sample) | 7.1% | 9.5% |
| Standard Deviation (Population) | 7.0% | 9.4% |
Similar Demographics by Poverty
Demographics Similar to Immigrants from Nicaragua by Poverty
In terms of poverty, the demographic groups most similar to Immigrants from Nicaragua are Cape Verdean (14.4%, a difference of 0.080%), Cherokee (14.4%, a difference of 0.10%), Immigrants from Liberia (14.4%, a difference of 0.26%), Ottawa (14.3%, a difference of 0.27%), and Trinidadian and Tobagonian (14.3%, a difference of 0.28%).
| Demographics | Rating | Rank | Poverty |
| Spanish American Indians | 0.2 /100 | #252 | Tragic 14.2% |
| Immigrants | Trinidad and Tobago | 0.2 /100 | #253 | Tragic 14.2% |
| Immigrants | El Salvador | 0.1 /100 | #254 | Tragic 14.3% |
| Immigrants | Ecuador | 0.1 /100 | #255 | Tragic 14.3% |
| Mexican American Indians | 0.1 /100 | #256 | Tragic 14.3% |
| Trinidadians and Tobagonians | 0.1 /100 | #257 | Tragic 14.3% |
| Ottawa | 0.1 /100 | #258 | Tragic 14.3% |
| Immigrants | Nicaragua | 0.1 /100 | #259 | Tragic 14.3% |
| Cape Verdeans | 0.1 /100 | #260 | Tragic 14.4% |
| Cherokee | 0.1 /100 | #261 | Tragic 14.4% |
| Immigrants | Liberia | 0.1 /100 | #262 | Tragic 14.4% |
| Jamaicans | 0.1 /100 | #263 | Tragic 14.4% |
| Immigrants | Jamaica | 0.1 /100 | #264 | Tragic 14.4% |
| Immigrants | Guyana | 0.1 /100 | #265 | Tragic 14.5% |
| Guyanese | 0.1 /100 | #266 | Tragic 14.5% |
Demographics Similar to Northern Europeans by Poverty
In terms of poverty, the demographic groups most similar to Northern Europeans are Jordanian (11.4%, a difference of 0.0%), Immigrants from England (11.4%, a difference of 0.12%), Belgian (11.4%, a difference of 0.14%), Czechoslovakian (11.4%, a difference of 0.18%), and English (11.3%, a difference of 0.19%).
| Demographics | Rating | Rank | Poverty |
| Indians (Asian) | 96.6 /100 | #80 | Exceptional 11.3% |
| Irish | 96.6 /100 | #81 | Exceptional 11.3% |
| Egyptians | 96.5 /100 | #82 | Exceptional 11.3% |
| Immigrants | Sweden | 96.3 /100 | #83 | Exceptional 11.3% |
| English | 96.3 /100 | #84 | Exceptional 11.3% |
| Immigrants | England | 96.2 /100 | #85 | Exceptional 11.4% |
| Jordanians | 96.0 /100 | #86 | Exceptional 11.4% |
| Northern Europeans | 96.0 /100 | #87 | Exceptional 11.4% |
| Belgians | 95.8 /100 | #88 | Exceptional 11.4% |
| Czechoslovakians | 95.7 /100 | #89 | Exceptional 11.4% |
| Immigrants | Denmark | 95.5 /100 | #90 | Exceptional 11.4% |
| Finns | 95.2 /100 | #91 | Exceptional 11.4% |
| British | 95.0 /100 | #92 | Exceptional 11.4% |
| Romanians | 94.9 /100 | #93 | Exceptional 11.4% |
| Paraguayans | 94.9 /100 | #94 | Exceptional 11.4% |