Immigrants from Northern Africa vs Danish Family Poverty
COMPARE
Immigrants from Northern Africa
Danish
Family Poverty
Family Poverty Comparison
Immigrants from Northern Africa
Danes
8.8%
FAMILY POVERTY
66.9/ 100
METRIC RATING
161st/ 347
METRIC RANK
7.3%
FAMILY POVERTY
99.7/ 100
METRIC RATING
22nd/ 347
METRIC RANK
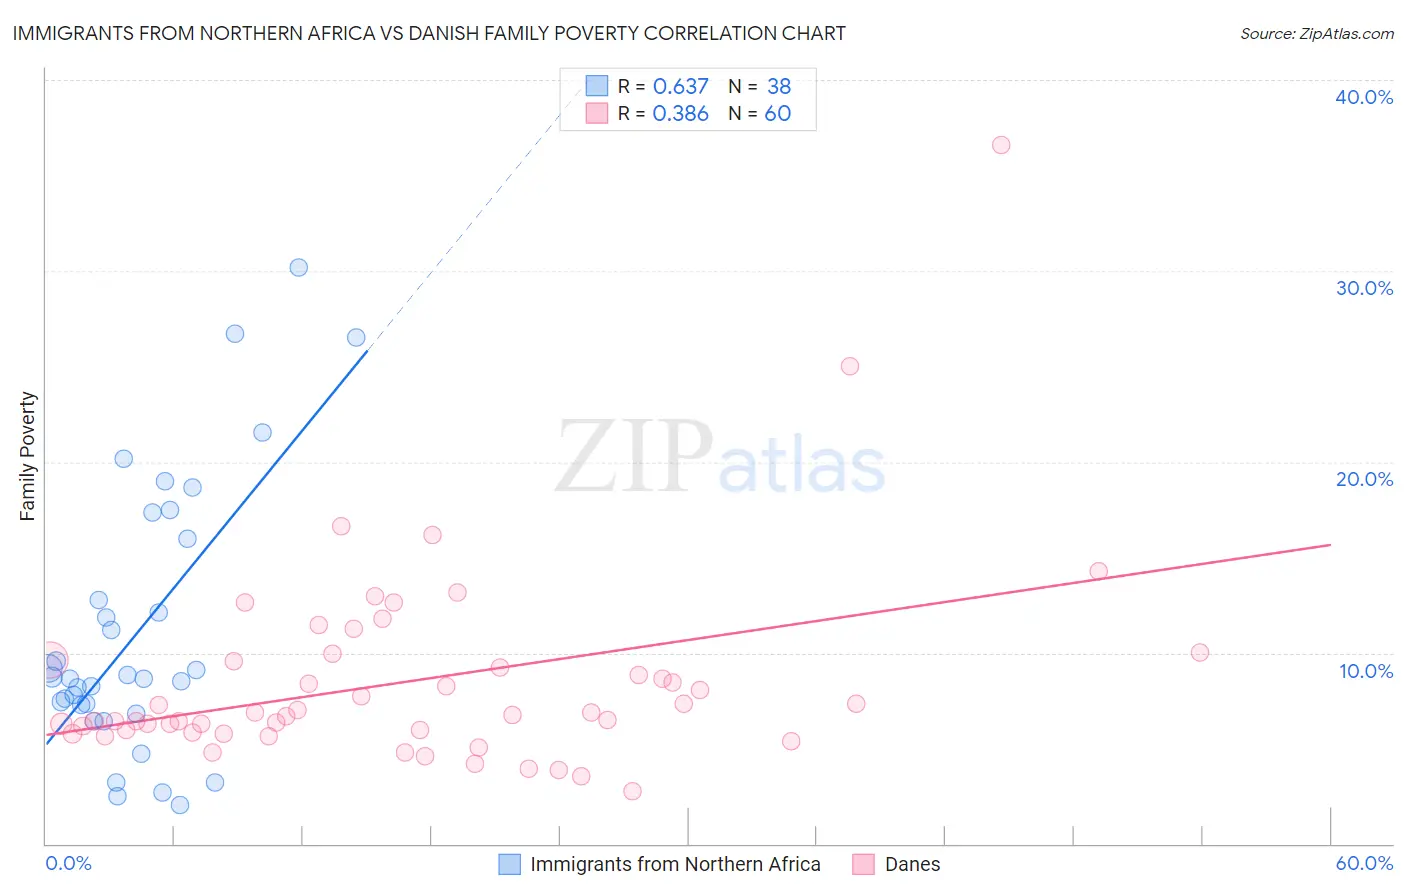
Immigrants from Northern Africa vs Danish Family Poverty Correlation Chart
The statistical analysis conducted on geographies consisting of 320,660,985 people shows a significant positive correlation between the proportion of Immigrants from Northern Africa and poverty level among families in the United States with a correlation coefficient (R) of 0.637 and weighted average of 8.8%. Similarly, the statistical analysis conducted on geographies consisting of 471,902,124 people shows a mild positive correlation between the proportion of Danes and poverty level among families in the United States with a correlation coefficient (R) of 0.386 and weighted average of 7.3%, a difference of 20.5%.
Family Poverty Correlation Summary
| Measurement | Immigrants from Northern Africa | Danish |
| Minimum | 2.0% | 2.7% |
| Maximum | 30.2% | 36.6% |
| Range | 28.1% | 33.8% |
| Mean | 11.2% | 8.5% |
| Median | 8.7% | 6.8% |
| Interquartile 25% (IQ1) | 7.3% | 5.9% |
| Interquartile 75% (IQ3) | 16.0% | 9.6% |
| Interquartile Range (IQR) | 8.7% | 3.7% |
| Standard Deviation (Sample) | 7.1% | 5.3% |
| Standard Deviation (Population) | 7.0% | 5.2% |
Similar Demographics by Family Poverty
Demographics Similar to Immigrants from Northern Africa by Family Poverty
In terms of family poverty, the demographic groups most similar to Immigrants from Northern Africa are Hungarian (8.8%, a difference of 0.040%), Ethiopian (8.8%, a difference of 0.090%), Pennsylvania German (8.8%, a difference of 0.14%), Peruvian (8.8%, a difference of 0.17%), and Celtic (8.8%, a difference of 0.30%).
| Demographics | Rating | Rank | Family Poverty |
| Immigrants | Vietnam | 75.4 /100 | #154 | Good 8.7% |
| Immigrants | Kuwait | 73.6 /100 | #155 | Good 8.7% |
| Immigrants | Oceania | 71.2 /100 | #156 | Good 8.7% |
| Tsimshian | 69.3 /100 | #157 | Good 8.8% |
| Whites/Caucasians | 69.1 /100 | #158 | Good 8.8% |
| Peruvians | 68.0 /100 | #159 | Good 8.8% |
| Hungarians | 67.2 /100 | #160 | Good 8.8% |
| Immigrants | Northern Africa | 66.9 /100 | #161 | Good 8.8% |
| Ethiopians | 66.3 /100 | #162 | Good 8.8% |
| Pennsylvania Germans | 66.0 /100 | #163 | Good 8.8% |
| Celtics | 64.9 /100 | #164 | Good 8.8% |
| Guamanians/Chamorros | 64.7 /100 | #165 | Good 8.8% |
| Afghans | 63.5 /100 | #166 | Good 8.8% |
| Immigrants | Ethiopia | 62.5 /100 | #167 | Good 8.9% |
| Israelis | 62.1 /100 | #168 | Good 8.9% |
Demographics Similar to Danes by Family Poverty
In terms of family poverty, the demographic groups most similar to Danes are Assyrian/Chaldean/Syriac (7.3%, a difference of 0.010%), Croatian (7.3%, a difference of 0.31%), Burmese (7.3%, a difference of 0.32%), Immigrants from Iran (7.3%, a difference of 0.44%), and Cypriot (7.3%, a difference of 0.56%).
| Demographics | Rating | Rank | Family Poverty |
| Lithuanians | 99.8 /100 | #15 | Exceptional 7.2% |
| Immigrants | South Central Asia | 99.8 /100 | #16 | Exceptional 7.2% |
| Luxembourgers | 99.8 /100 | #17 | Exceptional 7.2% |
| Immigrants | Lithuania | 99.8 /100 | #18 | Exceptional 7.2% |
| Eastern Europeans | 99.7 /100 | #19 | Exceptional 7.2% |
| Immigrants | Hong Kong | 99.7 /100 | #20 | Exceptional 7.3% |
| Immigrants | Iran | 99.7 /100 | #21 | Exceptional 7.3% |
| Danes | 99.7 /100 | #22 | Exceptional 7.3% |
| Assyrians/Chaldeans/Syriacs | 99.7 /100 | #23 | Exceptional 7.3% |
| Croatians | 99.7 /100 | #24 | Exceptional 7.3% |
| Burmese | 99.7 /100 | #25 | Exceptional 7.3% |
| Cypriots | 99.6 /100 | #26 | Exceptional 7.3% |
| Immigrants | Scotland | 99.6 /100 | #27 | Exceptional 7.3% |
| Immigrants | Korea | 99.6 /100 | #28 | Exceptional 7.4% |
| Immigrants | Northern Europe | 99.6 /100 | #29 | Exceptional 7.4% |