Immigrants from Congo vs Danish Family Poverty
COMPARE
Immigrants from Congo
Danish
Family Poverty
Family Poverty Comparison
Immigrants from Congo
Danes
11.9%
FAMILY POVERTY
0.0/ 100
METRIC RATING
307th/ 347
METRIC RANK
7.3%
FAMILY POVERTY
99.7/ 100
METRIC RATING
22nd/ 347
METRIC RANK
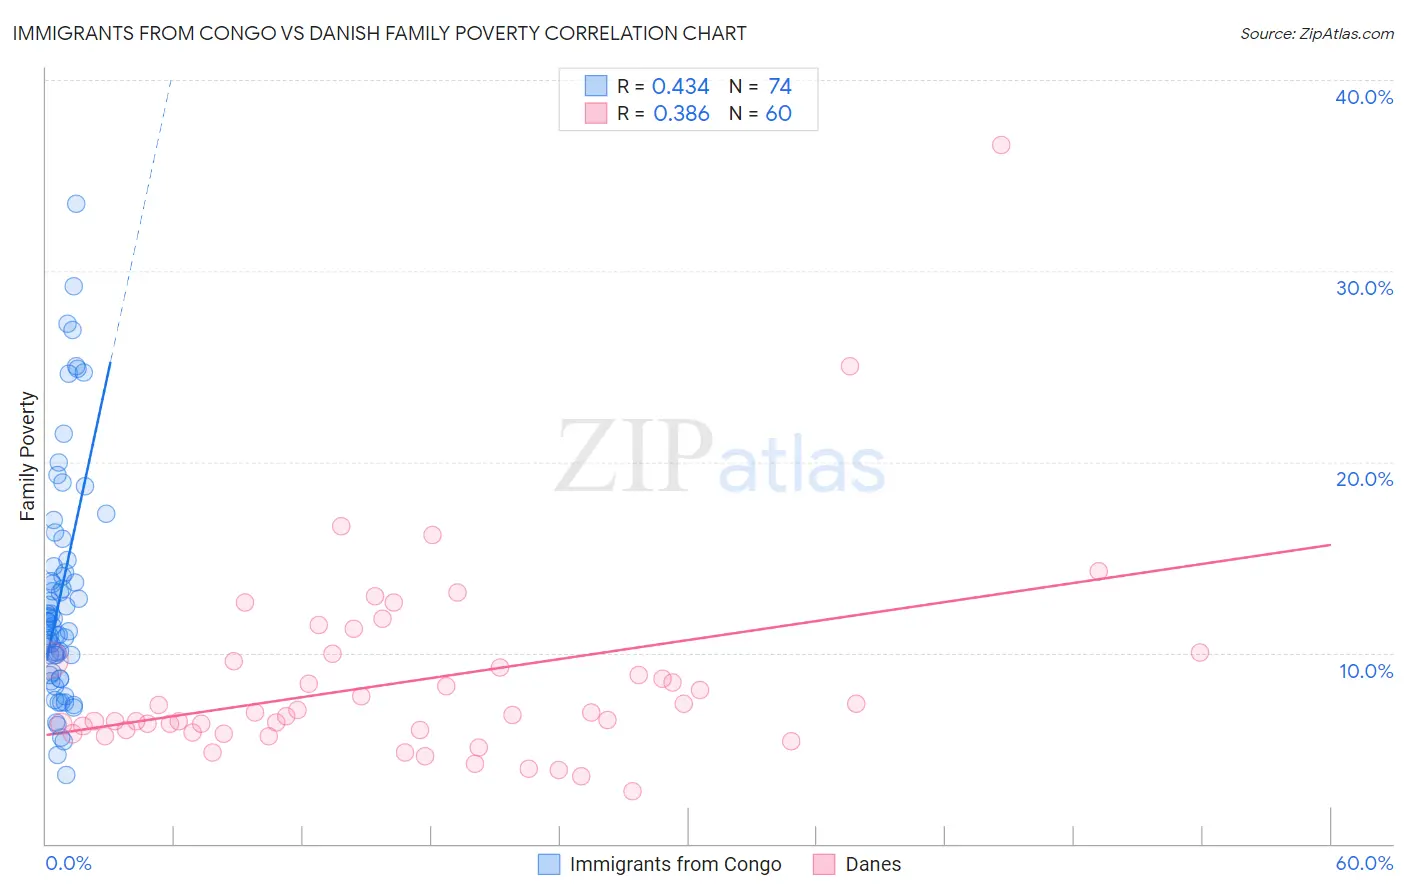
Immigrants from Congo vs Danish Family Poverty Correlation Chart
The statistical analysis conducted on geographies consisting of 92,062,434 people shows a moderate positive correlation between the proportion of Immigrants from Congo and poverty level among families in the United States with a correlation coefficient (R) of 0.434 and weighted average of 11.9%. Similarly, the statistical analysis conducted on geographies consisting of 471,902,124 people shows a mild positive correlation between the proportion of Danes and poverty level among families in the United States with a correlation coefficient (R) of 0.386 and weighted average of 7.3%, a difference of 63.0%.
Family Poverty Correlation Summary
| Measurement | Immigrants from Congo | Danish |
| Minimum | 3.6% | 2.7% |
| Maximum | 33.5% | 36.6% |
| Range | 29.9% | 33.8% |
| Mean | 13.1% | 8.5% |
| Median | 11.6% | 6.8% |
| Interquartile 25% (IQ1) | 9.0% | 5.9% |
| Interquartile 75% (IQ3) | 14.5% | 9.6% |
| Interquartile Range (IQR) | 5.5% | 3.7% |
| Standard Deviation (Sample) | 6.1% | 5.3% |
| Standard Deviation (Population) | 6.1% | 5.2% |
Similar Demographics by Family Poverty
Demographics Similar to Immigrants from Congo by Family Poverty
In terms of family poverty, the demographic groups most similar to Immigrants from Congo are Seminole (11.9%, a difference of 0.060%), Cajun (11.9%, a difference of 0.11%), Hispanic or Latino (12.0%, a difference of 0.50%), Immigrants from Guatemala (12.0%, a difference of 0.51%), and Mexican (11.8%, a difference of 0.67%).
| Demographics | Rating | Rank | Family Poverty |
| Immigrants | Bangladesh | 0.0 /100 | #300 | Tragic 11.7% |
| Bahamians | 0.0 /100 | #301 | Tragic 11.7% |
| Guatemalans | 0.0 /100 | #302 | Tragic 11.7% |
| Africans | 0.0 /100 | #303 | Tragic 11.8% |
| Immigrants | Latin America | 0.0 /100 | #304 | Tragic 11.8% |
| Mexicans | 0.0 /100 | #305 | Tragic 11.8% |
| Cajuns | 0.0 /100 | #306 | Tragic 11.9% |
| Immigrants | Congo | 0.0 /100 | #307 | Tragic 11.9% |
| Seminole | 0.0 /100 | #308 | Tragic 11.9% |
| Hispanics or Latinos | 0.0 /100 | #309 | Tragic 12.0% |
| Immigrants | Guatemala | 0.0 /100 | #310 | Tragic 12.0% |
| Ute | 0.0 /100 | #311 | Tragic 12.1% |
| Immigrants | Central America | 0.0 /100 | #312 | Tragic 12.1% |
| Immigrants | Caribbean | 0.0 /100 | #313 | Tragic 12.2% |
| Kiowa | 0.0 /100 | #314 | Tragic 12.2% |
Demographics Similar to Danes by Family Poverty
In terms of family poverty, the demographic groups most similar to Danes are Assyrian/Chaldean/Syriac (7.3%, a difference of 0.010%), Croatian (7.3%, a difference of 0.31%), Burmese (7.3%, a difference of 0.32%), Immigrants from Iran (7.3%, a difference of 0.44%), and Cypriot (7.3%, a difference of 0.56%).
| Demographics | Rating | Rank | Family Poverty |
| Lithuanians | 99.8 /100 | #15 | Exceptional 7.2% |
| Immigrants | South Central Asia | 99.8 /100 | #16 | Exceptional 7.2% |
| Luxembourgers | 99.8 /100 | #17 | Exceptional 7.2% |
| Immigrants | Lithuania | 99.8 /100 | #18 | Exceptional 7.2% |
| Eastern Europeans | 99.7 /100 | #19 | Exceptional 7.2% |
| Immigrants | Hong Kong | 99.7 /100 | #20 | Exceptional 7.3% |
| Immigrants | Iran | 99.7 /100 | #21 | Exceptional 7.3% |
| Danes | 99.7 /100 | #22 | Exceptional 7.3% |
| Assyrians/Chaldeans/Syriacs | 99.7 /100 | #23 | Exceptional 7.3% |
| Croatians | 99.7 /100 | #24 | Exceptional 7.3% |
| Burmese | 99.7 /100 | #25 | Exceptional 7.3% |
| Cypriots | 99.6 /100 | #26 | Exceptional 7.3% |
| Immigrants | Scotland | 99.6 /100 | #27 | Exceptional 7.3% |
| Immigrants | Korea | 99.6 /100 | #28 | Exceptional 7.4% |
| Immigrants | Northern Europe | 99.6 /100 | #29 | Exceptional 7.4% |