Immigrants from Northern Africa vs Aleut Family Poverty
COMPARE
Immigrants from Northern Africa
Aleut
Family Poverty
Family Poverty Comparison
Immigrants from Northern Africa
Aleuts
8.8%
FAMILY POVERTY
66.9/ 100
METRIC RATING
161st/ 347
METRIC RANK
9.5%
FAMILY POVERTY
18.0/ 100
METRIC RATING
205th/ 347
METRIC RANK
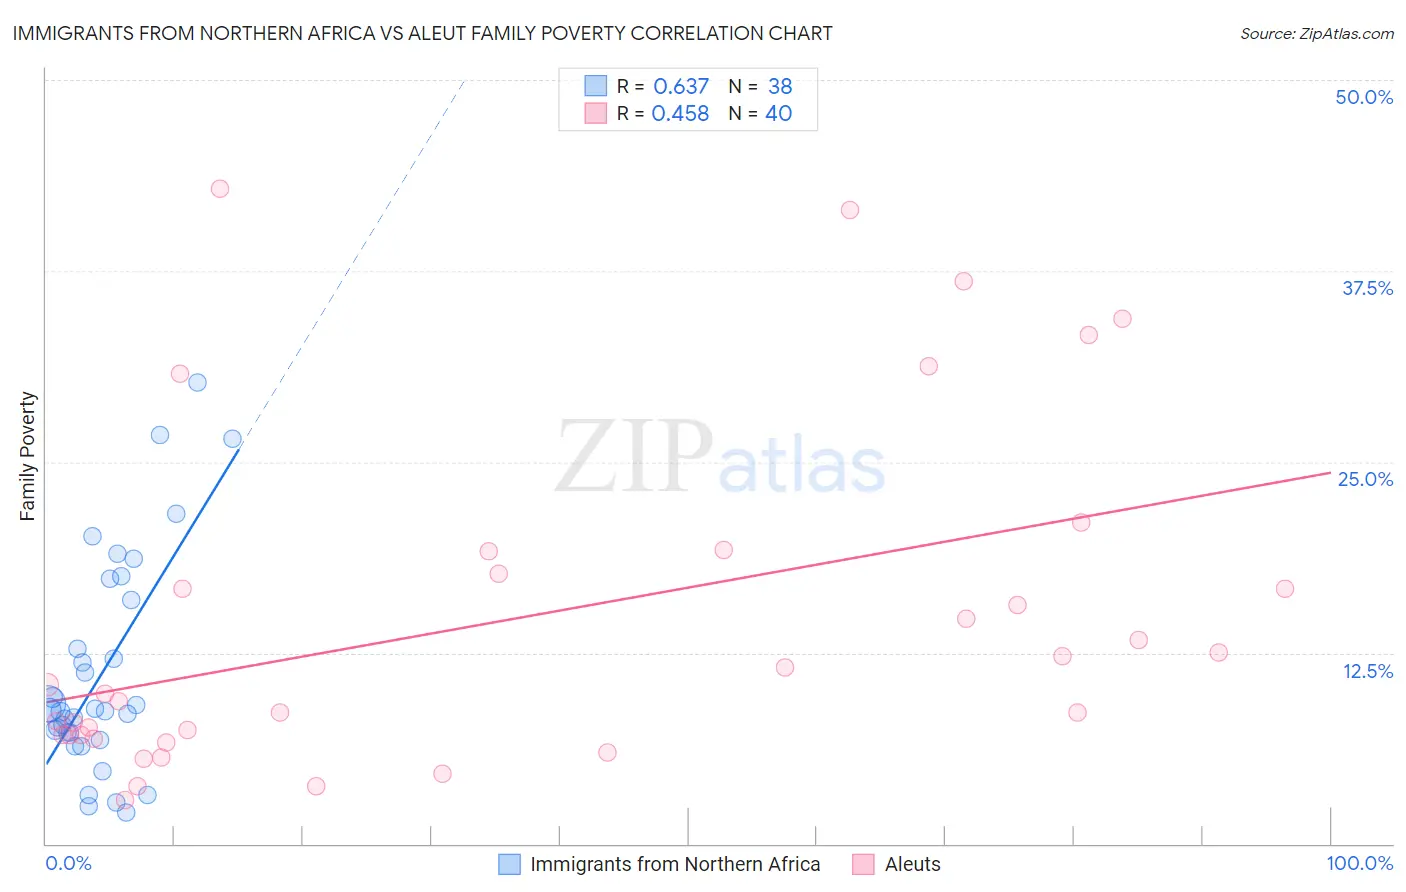
Immigrants from Northern Africa vs Aleut Family Poverty Correlation Chart
The statistical analysis conducted on geographies consisting of 320,660,985 people shows a significant positive correlation between the proportion of Immigrants from Northern Africa and poverty level among families in the United States with a correlation coefficient (R) of 0.637 and weighted average of 8.8%. Similarly, the statistical analysis conducted on geographies consisting of 61,739,595 people shows a moderate positive correlation between the proportion of Aleuts and poverty level among families in the United States with a correlation coefficient (R) of 0.458 and weighted average of 9.5%, a difference of 7.4%.
Family Poverty Correlation Summary
| Measurement | Immigrants from Northern Africa | Aleut |
| Minimum | 2.0% | 2.9% |
| Maximum | 30.2% | 42.9% |
| Range | 28.1% | 40.0% |
| Mean | 11.2% | 14.6% |
| Median | 8.7% | 10.1% |
| Interquartile 25% (IQ1) | 7.3% | 7.1% |
| Interquartile 75% (IQ3) | 16.0% | 18.4% |
| Interquartile Range (IQR) | 8.7% | 11.3% |
| Standard Deviation (Sample) | 7.1% | 11.0% |
| Standard Deviation (Population) | 7.0% | 10.9% |
Similar Demographics by Family Poverty
Demographics Similar to Immigrants from Northern Africa by Family Poverty
In terms of family poverty, the demographic groups most similar to Immigrants from Northern Africa are Hungarian (8.8%, a difference of 0.040%), Ethiopian (8.8%, a difference of 0.090%), Pennsylvania German (8.8%, a difference of 0.14%), Peruvian (8.8%, a difference of 0.17%), and Celtic (8.8%, a difference of 0.30%).
| Demographics | Rating | Rank | Family Poverty |
| Immigrants | Vietnam | 75.4 /100 | #154 | Good 8.7% |
| Immigrants | Kuwait | 73.6 /100 | #155 | Good 8.7% |
| Immigrants | Oceania | 71.2 /100 | #156 | Good 8.7% |
| Tsimshian | 69.3 /100 | #157 | Good 8.8% |
| Whites/Caucasians | 69.1 /100 | #158 | Good 8.8% |
| Peruvians | 68.0 /100 | #159 | Good 8.8% |
| Hungarians | 67.2 /100 | #160 | Good 8.8% |
| Immigrants | Northern Africa | 66.9 /100 | #161 | Good 8.8% |
| Ethiopians | 66.3 /100 | #162 | Good 8.8% |
| Pennsylvania Germans | 66.0 /100 | #163 | Good 8.8% |
| Celtics | 64.9 /100 | #164 | Good 8.8% |
| Guamanians/Chamorros | 64.7 /100 | #165 | Good 8.8% |
| Afghans | 63.5 /100 | #166 | Good 8.8% |
| Immigrants | Ethiopia | 62.5 /100 | #167 | Good 8.9% |
| Israelis | 62.1 /100 | #168 | Good 8.9% |
Demographics Similar to Aleuts by Family Poverty
In terms of family poverty, the demographic groups most similar to Aleuts are Immigrants from South America (9.5%, a difference of 0.010%), Immigrants from Lebanon (9.4%, a difference of 0.19%), German Russian (9.4%, a difference of 0.29%), Immigrants from Sierra Leone (9.4%, a difference of 0.33%), and Immigrants from Portugal (9.4%, a difference of 0.51%).
| Demographics | Rating | Rank | Family Poverty |
| Iraqis | 24.2 /100 | #198 | Fair 9.3% |
| Spaniards | 22.8 /100 | #199 | Fair 9.4% |
| Immigrants | Costa Rica | 21.7 /100 | #200 | Fair 9.4% |
| Immigrants | Portugal | 20.5 /100 | #201 | Fair 9.4% |
| Immigrants | Sierra Leone | 19.6 /100 | #202 | Poor 9.4% |
| German Russians | 19.4 /100 | #203 | Poor 9.4% |
| Immigrants | Lebanon | 18.9 /100 | #204 | Poor 9.4% |
| Aleuts | 18.0 /100 | #205 | Poor 9.5% |
| Immigrants | South America | 18.0 /100 | #206 | Poor 9.5% |
| Sierra Leoneans | 15.6 /100 | #207 | Poor 9.5% |
| Immigrants | Eastern Africa | 15.1 /100 | #208 | Poor 9.5% |
| Immigrants | Uruguay | 14.0 /100 | #209 | Poor 9.5% |
| Alsatians | 11.3 /100 | #210 | Poor 9.6% |
| Malaysians | 10.6 /100 | #211 | Poor 9.6% |
| Immigrants | Thailand | 9.7 /100 | #212 | Tragic 9.7% |