Immigrants from Korea vs Danish Family Poverty
COMPARE
Immigrants from Korea
Danish
Family Poverty
Family Poverty Comparison
Immigrants from Korea
Danes
7.4%
FAMILY POVERTY
99.6/ 100
METRIC RATING
28th/ 347
METRIC RANK
7.3%
FAMILY POVERTY
99.7/ 100
METRIC RATING
22nd/ 347
METRIC RANK
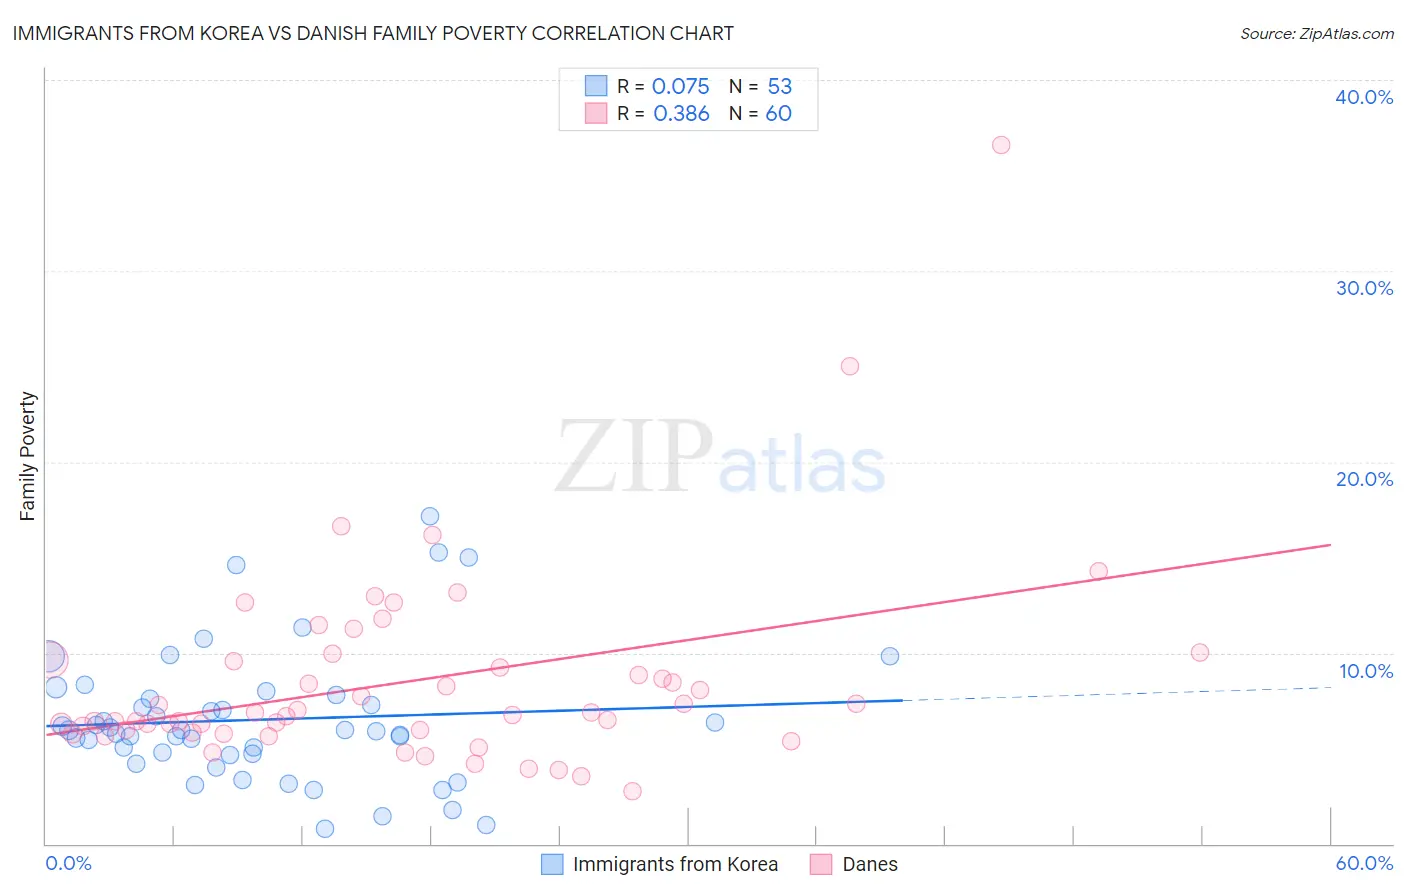
Immigrants from Korea vs Danish Family Poverty Correlation Chart
The statistical analysis conducted on geographies consisting of 414,824,351 people shows a slight positive correlation between the proportion of Immigrants from Korea and poverty level among families in the United States with a correlation coefficient (R) of 0.075 and weighted average of 7.4%. Similarly, the statistical analysis conducted on geographies consisting of 471,902,124 people shows a mild positive correlation between the proportion of Danes and poverty level among families in the United States with a correlation coefficient (R) of 0.386 and weighted average of 7.3%, a difference of 0.97%.
Family Poverty Correlation Summary
| Measurement | Immigrants from Korea | Danish |
| Minimum | 0.76% | 2.7% |
| Maximum | 17.2% | 36.6% |
| Range | 16.4% | 33.8% |
| Mean | 6.5% | 8.5% |
| Median | 5.9% | 6.8% |
| Interquartile 25% (IQ1) | 4.7% | 5.9% |
| Interquartile 75% (IQ3) | 7.7% | 9.6% |
| Interquartile Range (IQR) | 3.0% | 3.7% |
| Standard Deviation (Sample) | 3.5% | 5.3% |
| Standard Deviation (Population) | 3.5% | 5.2% |
Demographics Similar to Immigrants from Korea and Danes by Family Poverty
In terms of family poverty, the demographic groups most similar to Immigrants from Korea are Immigrants from Northern Europe (7.4%, a difference of 0.17%), Immigrants from Scotland (7.3%, a difference of 0.39%), Cypriot (7.3%, a difference of 0.40%), Italian (7.4%, a difference of 0.46%), and Czech (7.4%, a difference of 0.58%). Similarly, the demographic groups most similar to Danes are Assyrian/Chaldean/Syriac (7.3%, a difference of 0.010%), Croatian (7.3%, a difference of 0.31%), Burmese (7.3%, a difference of 0.32%), Immigrants from Iran (7.3%, a difference of 0.44%), and Cypriot (7.3%, a difference of 0.56%).
| Demographics | Rating | Rank | Family Poverty |
| Lithuanians | 99.8 /100 | #15 | Exceptional 7.2% |
| Immigrants | South Central Asia | 99.8 /100 | #16 | Exceptional 7.2% |
| Luxembourgers | 99.8 /100 | #17 | Exceptional 7.2% |
| Immigrants | Lithuania | 99.8 /100 | #18 | Exceptional 7.2% |
| Eastern Europeans | 99.7 /100 | #19 | Exceptional 7.2% |
| Immigrants | Hong Kong | 99.7 /100 | #20 | Exceptional 7.3% |
| Immigrants | Iran | 99.7 /100 | #21 | Exceptional 7.3% |
| Danes | 99.7 /100 | #22 | Exceptional 7.3% |
| Assyrians/Chaldeans/Syriacs | 99.7 /100 | #23 | Exceptional 7.3% |
| Croatians | 99.7 /100 | #24 | Exceptional 7.3% |
| Burmese | 99.7 /100 | #25 | Exceptional 7.3% |
| Cypriots | 99.6 /100 | #26 | Exceptional 7.3% |
| Immigrants | Scotland | 99.6 /100 | #27 | Exceptional 7.3% |
| Immigrants | Korea | 99.6 /100 | #28 | Exceptional 7.4% |
| Immigrants | Northern Europe | 99.6 /100 | #29 | Exceptional 7.4% |
| Italians | 99.6 /100 | #30 | Exceptional 7.4% |
| Czechs | 99.6 /100 | #31 | Exceptional 7.4% |
| Poles | 99.5 /100 | #32 | Exceptional 7.4% |
| Immigrants | Japan | 99.5 /100 | #33 | Exceptional 7.4% |
| Russians | 99.5 /100 | #34 | Exceptional 7.5% |
| Greeks | 99.4 /100 | #35 | Exceptional 7.5% |