Immigrants from Hungary vs Danish Family Poverty
COMPARE
Immigrants from Hungary
Danish
Family Poverty
Family Poverty Comparison
Immigrants from Hungary
Danes
8.4%
FAMILY POVERTY
89.9/ 100
METRIC RATING
127th/ 347
METRIC RANK
7.3%
FAMILY POVERTY
99.7/ 100
METRIC RATING
22nd/ 347
METRIC RANK
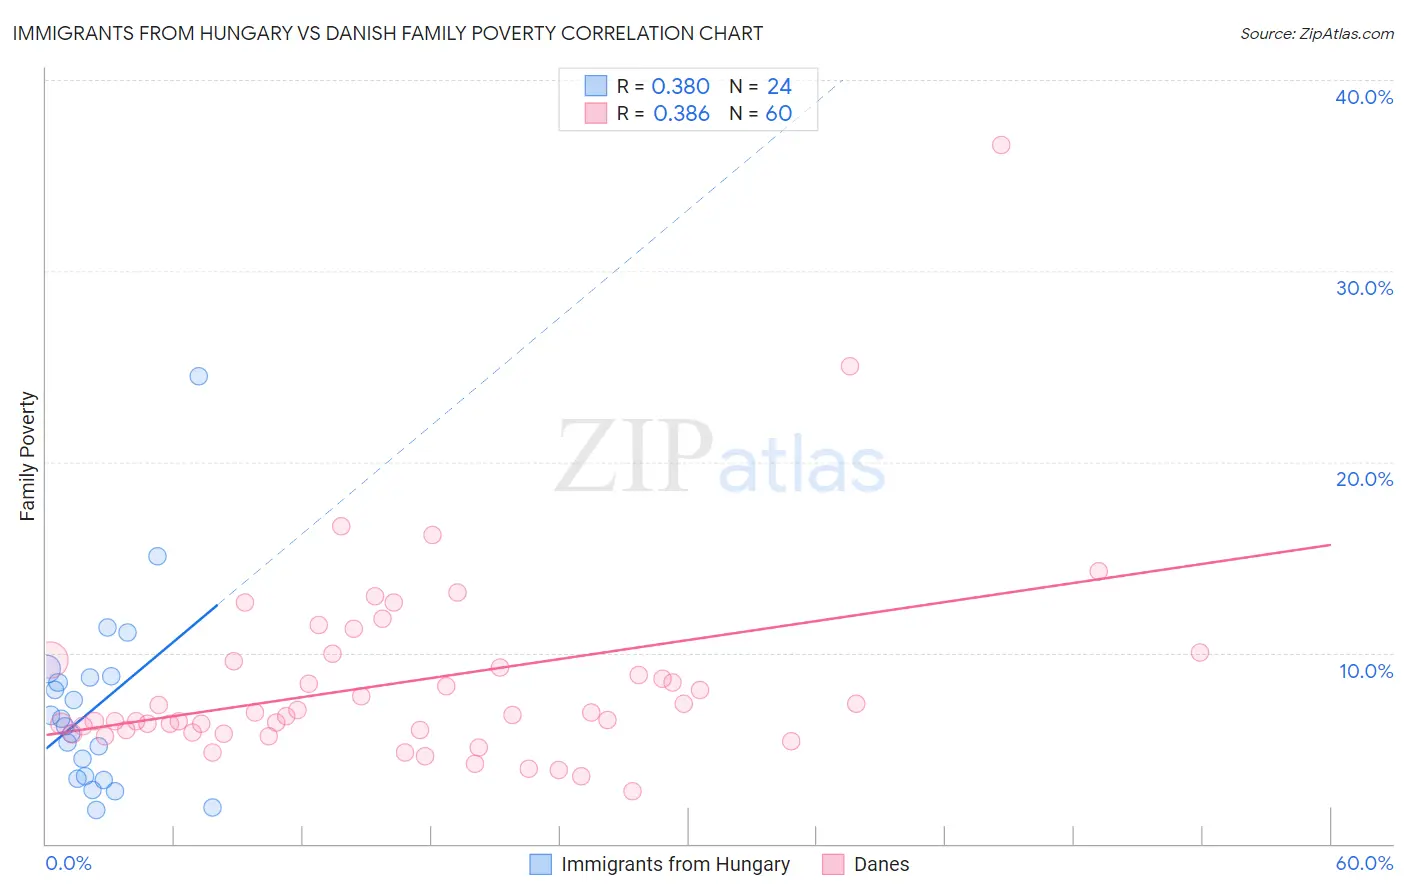
Immigrants from Hungary vs Danish Family Poverty Correlation Chart
The statistical analysis conducted on geographies consisting of 195,433,579 people shows a mild positive correlation between the proportion of Immigrants from Hungary and poverty level among families in the United States with a correlation coefficient (R) of 0.380 and weighted average of 8.4%. Similarly, the statistical analysis conducted on geographies consisting of 471,902,124 people shows a mild positive correlation between the proportion of Danes and poverty level among families in the United States with a correlation coefficient (R) of 0.386 and weighted average of 7.3%, a difference of 14.5%.
Family Poverty Correlation Summary
| Measurement | Immigrants from Hungary | Danish |
| Minimum | 1.8% | 2.7% |
| Maximum | 24.5% | 36.6% |
| Range | 22.7% | 33.8% |
| Mean | 7.2% | 8.5% |
| Median | 6.4% | 6.8% |
| Interquartile 25% (IQ1) | 3.5% | 5.9% |
| Interquartile 75% (IQ3) | 8.7% | 9.6% |
| Interquartile Range (IQR) | 5.2% | 3.7% |
| Standard Deviation (Sample) | 4.9% | 5.3% |
| Standard Deviation (Population) | 4.8% | 5.2% |
Similar Demographics by Family Poverty
Demographics Similar to Immigrants from Hungary by Family Poverty
In terms of family poverty, the demographic groups most similar to Immigrants from Hungary are Icelander (8.3%, a difference of 0.13%), Argentinean (8.4%, a difference of 0.14%), Portuguese (8.4%, a difference of 0.30%), Pakistani (8.3%, a difference of 0.33%), and Soviet Union (8.3%, a difference of 0.37%).
| Demographics | Rating | Rank | Family Poverty |
| Immigrants | Egypt | 91.6 /100 | #120 | Exceptional 8.3% |
| Native Hawaiians | 91.3 /100 | #121 | Exceptional 8.3% |
| Paraguayans | 91.2 /100 | #122 | Exceptional 8.3% |
| Palestinians | 91.1 /100 | #123 | Exceptional 8.3% |
| Soviet Union | 90.8 /100 | #124 | Exceptional 8.3% |
| Pakistanis | 90.8 /100 | #125 | Exceptional 8.3% |
| Icelanders | 90.3 /100 | #126 | Exceptional 8.3% |
| Immigrants | Hungary | 89.9 /100 | #127 | Excellent 8.4% |
| Argentineans | 89.6 /100 | #128 | Excellent 8.4% |
| Portuguese | 89.2 /100 | #129 | Excellent 8.4% |
| Immigrants | Bosnia and Herzegovina | 88.6 /100 | #130 | Excellent 8.4% |
| Puget Sound Salish | 88.6 /100 | #131 | Excellent 8.4% |
| Immigrants | Argentina | 88.2 /100 | #132 | Excellent 8.4% |
| Sri Lankans | 86.6 /100 | #133 | Excellent 8.5% |
| Chileans | 86.6 /100 | #134 | Excellent 8.5% |
Demographics Similar to Danes by Family Poverty
In terms of family poverty, the demographic groups most similar to Danes are Assyrian/Chaldean/Syriac (7.3%, a difference of 0.010%), Croatian (7.3%, a difference of 0.31%), Burmese (7.3%, a difference of 0.32%), Immigrants from Iran (7.3%, a difference of 0.44%), and Cypriot (7.3%, a difference of 0.56%).
| Demographics | Rating | Rank | Family Poverty |
| Lithuanians | 99.8 /100 | #15 | Exceptional 7.2% |
| Immigrants | South Central Asia | 99.8 /100 | #16 | Exceptional 7.2% |
| Luxembourgers | 99.8 /100 | #17 | Exceptional 7.2% |
| Immigrants | Lithuania | 99.8 /100 | #18 | Exceptional 7.2% |
| Eastern Europeans | 99.7 /100 | #19 | Exceptional 7.2% |
| Immigrants | Hong Kong | 99.7 /100 | #20 | Exceptional 7.3% |
| Immigrants | Iran | 99.7 /100 | #21 | Exceptional 7.3% |
| Danes | 99.7 /100 | #22 | Exceptional 7.3% |
| Assyrians/Chaldeans/Syriacs | 99.7 /100 | #23 | Exceptional 7.3% |
| Croatians | 99.7 /100 | #24 | Exceptional 7.3% |
| Burmese | 99.7 /100 | #25 | Exceptional 7.3% |
| Cypriots | 99.6 /100 | #26 | Exceptional 7.3% |
| Immigrants | Scotland | 99.6 /100 | #27 | Exceptional 7.3% |
| Immigrants | Korea | 99.6 /100 | #28 | Exceptional 7.4% |
| Immigrants | Northern Europe | 99.6 /100 | #29 | Exceptional 7.4% |