Immigrants from North America vs Arab Single Female Poverty
COMPARE
Immigrants from North America
Arab
Single Female Poverty
Single Female Poverty Comparison
Immigrants from North America
Arabs
20.3%
SINGLE FEMALE POVERTY
89.5/ 100
METRIC RATING
141st/ 347
METRIC RANK
20.7%
SINGLE FEMALE POVERTY
70.8/ 100
METRIC RATING
160th/ 347
METRIC RANK
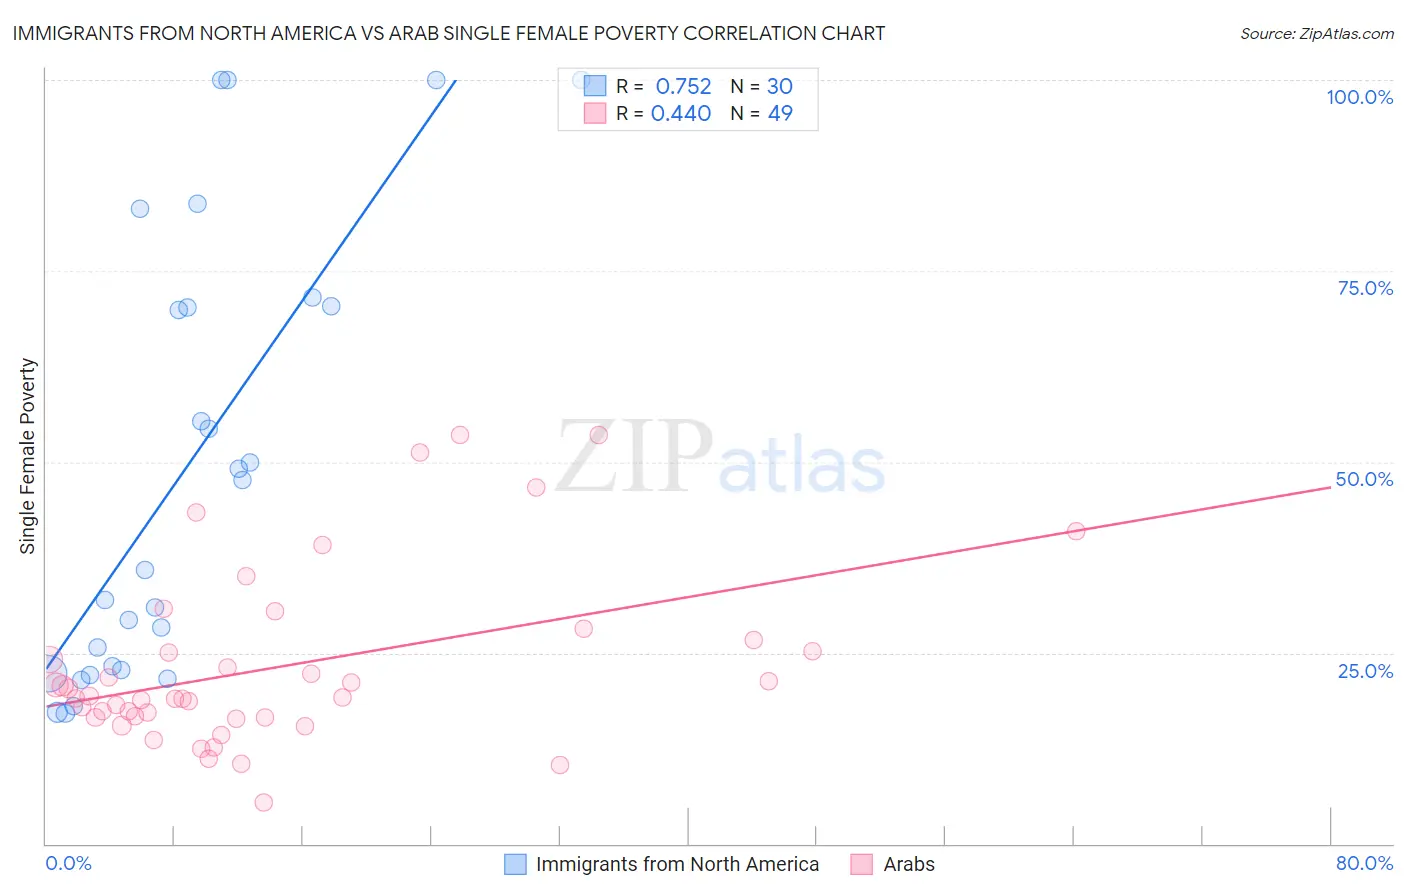
Immigrants from North America vs Arab Single Female Poverty Correlation Chart
The statistical analysis conducted on geographies consisting of 451,673,972 people shows a strong positive correlation between the proportion of Immigrants from North America and poverty level among single females in the United States with a correlation coefficient (R) of 0.752 and weighted average of 20.3%. Similarly, the statistical analysis conducted on geographies consisting of 476,036,809 people shows a moderate positive correlation between the proportion of Arabs and poverty level among single females in the United States with a correlation coefficient (R) of 0.440 and weighted average of 20.7%, a difference of 2.0%.
Single Female Poverty Correlation Summary
| Measurement | Immigrants from North America | Arab |
| Minimum | 17.0% | 5.5% |
| Maximum | 100.0% | 53.6% |
| Range | 83.0% | 48.1% |
| Mean | 49.1% | 23.1% |
| Median | 41.8% | 19.2% |
| Interquartile 25% (IQ1) | 22.7% | 16.6% |
| Interquartile 75% (IQ3) | 70.4% | 25.9% |
| Interquartile Range (IQR) | 47.6% | 9.4% |
| Standard Deviation (Sample) | 28.9% | 11.4% |
| Standard Deviation (Population) | 28.4% | 11.3% |
Demographics Similar to Immigrants from North America and Arabs by Single Female Poverty
In terms of single female poverty, the demographic groups most similar to Immigrants from North America are Immigrants from Uganda (20.3%, a difference of 0.080%), Syrian (20.3%, a difference of 0.15%), Australian (20.3%, a difference of 0.19%), Immigrants from Uzbekistan (20.3%, a difference of 0.20%), and Austrian (20.4%, a difference of 0.57%). Similarly, the demographic groups most similar to Arabs are Costa Rican (20.7%, a difference of 0.080%), Danish (20.7%, a difference of 0.17%), Immigrants from Oceania (20.7%, a difference of 0.27%), South American Indian (20.6%, a difference of 0.39%), and Samoan (20.6%, a difference of 0.42%).
| Demographics | Rating | Rank | Single Female Poverty |
| Syrians | 90.4 /100 | #140 | Exceptional 20.3% |
| Immigrants | North America | 89.5 /100 | #141 | Excellent 20.3% |
| Immigrants | Uganda | 89.1 /100 | #142 | Excellent 20.3% |
| Australians | 88.4 /100 | #143 | Excellent 20.3% |
| Immigrants | Uzbekistan | 88.3 /100 | #144 | Excellent 20.3% |
| Austrians | 85.8 /100 | #145 | Excellent 20.4% |
| Venezuelans | 85.5 /100 | #146 | Excellent 20.4% |
| South Africans | 85.3 /100 | #147 | Excellent 20.4% |
| Luxembourgers | 84.9 /100 | #148 | Excellent 20.4% |
| Portuguese | 81.5 /100 | #149 | Excellent 20.5% |
| Immigrants | Denmark | 80.5 /100 | #150 | Excellent 20.5% |
| Puget Sound Salish | 79.6 /100 | #151 | Good 20.6% |
| Immigrants | Uruguay | 77.7 /100 | #152 | Good 20.6% |
| Swedes | 77.1 /100 | #153 | Good 20.6% |
| Immigrants | Western Europe | 76.7 /100 | #154 | Good 20.6% |
| Samoans | 76.0 /100 | #155 | Good 20.6% |
| South American Indians | 75.7 /100 | #156 | Good 20.6% |
| Immigrants | Oceania | 74.3 /100 | #157 | Good 20.7% |
| Danes | 73.0 /100 | #158 | Good 20.7% |
| Costa Ricans | 71.8 /100 | #159 | Good 20.7% |
| Arabs | 70.8 /100 | #160 | Good 20.7% |