Dutch vs Arab Single Female Poverty
COMPARE
Dutch
Arab
Single Female Poverty
Single Female Poverty Comparison
Dutch
Arabs
22.0%
SINGLE FEMALE POVERTY
4.6/ 100
METRIC RATING
235th/ 347
METRIC RANK
20.7%
SINGLE FEMALE POVERTY
70.8/ 100
METRIC RATING
160th/ 347
METRIC RANK
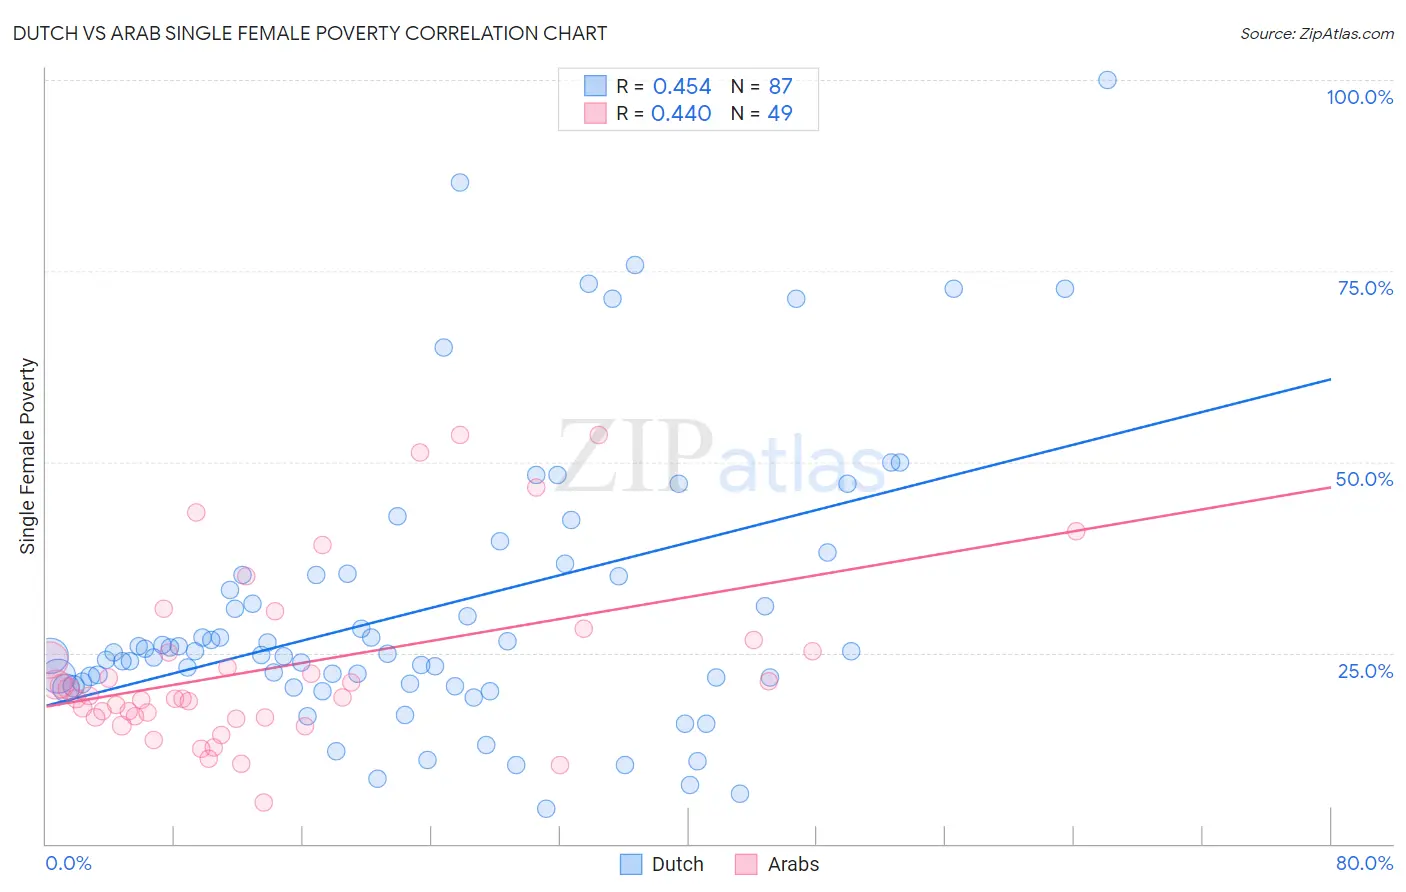
Dutch vs Arab Single Female Poverty Correlation Chart
The statistical analysis conducted on geographies consisting of 536,025,433 people shows a moderate positive correlation between the proportion of Dutch and poverty level among single females in the United States with a correlation coefficient (R) of 0.454 and weighted average of 22.0%. Similarly, the statistical analysis conducted on geographies consisting of 476,036,809 people shows a moderate positive correlation between the proportion of Arabs and poverty level among single females in the United States with a correlation coefficient (R) of 0.440 and weighted average of 20.7%, a difference of 6.2%.
Single Female Poverty Correlation Summary
| Measurement | Dutch | Arab |
| Minimum | 4.6% | 5.5% |
| Maximum | 100.0% | 53.6% |
| Range | 95.4% | 48.1% |
| Mean | 30.8% | 23.1% |
| Median | 25.0% | 19.2% |
| Interquartile 25% (IQ1) | 20.9% | 16.6% |
| Interquartile 75% (IQ3) | 35.2% | 25.9% |
| Interquartile Range (IQR) | 14.3% | 9.4% |
| Standard Deviation (Sample) | 18.7% | 11.4% |
| Standard Deviation (Population) | 18.6% | 11.3% |
Similar Demographics by Single Female Poverty
Demographics Similar to Dutch by Single Female Poverty
In terms of single female poverty, the demographic groups most similar to Dutch are Spaniard (22.0%, a difference of 0.020%), Spanish (22.0%, a difference of 0.020%), Immigrants from Thailand (22.0%, a difference of 0.12%), Welsh (22.0%, a difference of 0.13%), and Immigrants from Ecuador (22.0%, a difference of 0.16%).
| Demographics | Rating | Rank | Single Female Poverty |
| Salvadorans | 5.5 /100 | #228 | Tragic 21.9% |
| Tlingit-Haida | 5.4 /100 | #229 | Tragic 21.9% |
| Immigrants | Western Africa | 5.3 /100 | #230 | Tragic 22.0% |
| Welsh | 5.0 /100 | #231 | Tragic 22.0% |
| Immigrants | Thailand | 5.0 /100 | #232 | Tragic 22.0% |
| Spaniards | 4.7 /100 | #233 | Tragic 22.0% |
| Spanish | 4.7 /100 | #234 | Tragic 22.0% |
| Dutch | 4.6 /100 | #235 | Tragic 22.0% |
| Immigrants | Ecuador | 4.2 /100 | #236 | Tragic 22.0% |
| Vietnamese | 4.0 /100 | #237 | Tragic 22.0% |
| French Canadians | 2.8 /100 | #238 | Tragic 22.2% |
| Malaysians | 2.8 /100 | #239 | Tragic 22.2% |
| French | 2.3 /100 | #240 | Tragic 22.2% |
| Cape Verdeans | 2.1 /100 | #241 | Tragic 22.3% |
| Bermudans | 2.0 /100 | #242 | Tragic 22.3% |
Demographics Similar to Arabs by Single Female Poverty
In terms of single female poverty, the demographic groups most similar to Arabs are Costa Rican (20.7%, a difference of 0.080%), Danish (20.7%, a difference of 0.17%), Kenyan (20.8%, a difference of 0.18%), Northern European (20.8%, a difference of 0.18%), and Lebanese (20.8%, a difference of 0.24%).
| Demographics | Rating | Rank | Single Female Poverty |
| Swedes | 77.1 /100 | #153 | Good 20.6% |
| Immigrants | Western Europe | 76.7 /100 | #154 | Good 20.6% |
| Samoans | 76.0 /100 | #155 | Good 20.6% |
| South American Indians | 75.7 /100 | #156 | Good 20.6% |
| Immigrants | Oceania | 74.3 /100 | #157 | Good 20.7% |
| Danes | 73.0 /100 | #158 | Good 20.7% |
| Costa Ricans | 71.8 /100 | #159 | Good 20.7% |
| Arabs | 70.8 /100 | #160 | Good 20.7% |
| Kenyans | 68.5 /100 | #161 | Good 20.8% |
| Northern Europeans | 68.4 /100 | #162 | Good 20.8% |
| Lebanese | 67.6 /100 | #163 | Good 20.8% |
| Iraqis | 64.5 /100 | #164 | Good 20.8% |
| Ugandans | 64.0 /100 | #165 | Good 20.8% |
| Norwegians | 63.0 /100 | #166 | Good 20.8% |
| Immigrants | Norway | 63.0 /100 | #167 | Good 20.8% |