Immigrants from North America vs Alaskan Athabascan Single Female Poverty
COMPARE
Immigrants from North America
Alaskan Athabascan
Single Female Poverty
Single Female Poverty Comparison
Immigrants from North America
Alaskan Athabascans
20.3%
SINGLE FEMALE POVERTY
89.5/ 100
METRIC RATING
141st/ 347
METRIC RANK
23.6%
SINGLE FEMALE POVERTY
0.0/ 100
METRIC RATING
279th/ 347
METRIC RANK
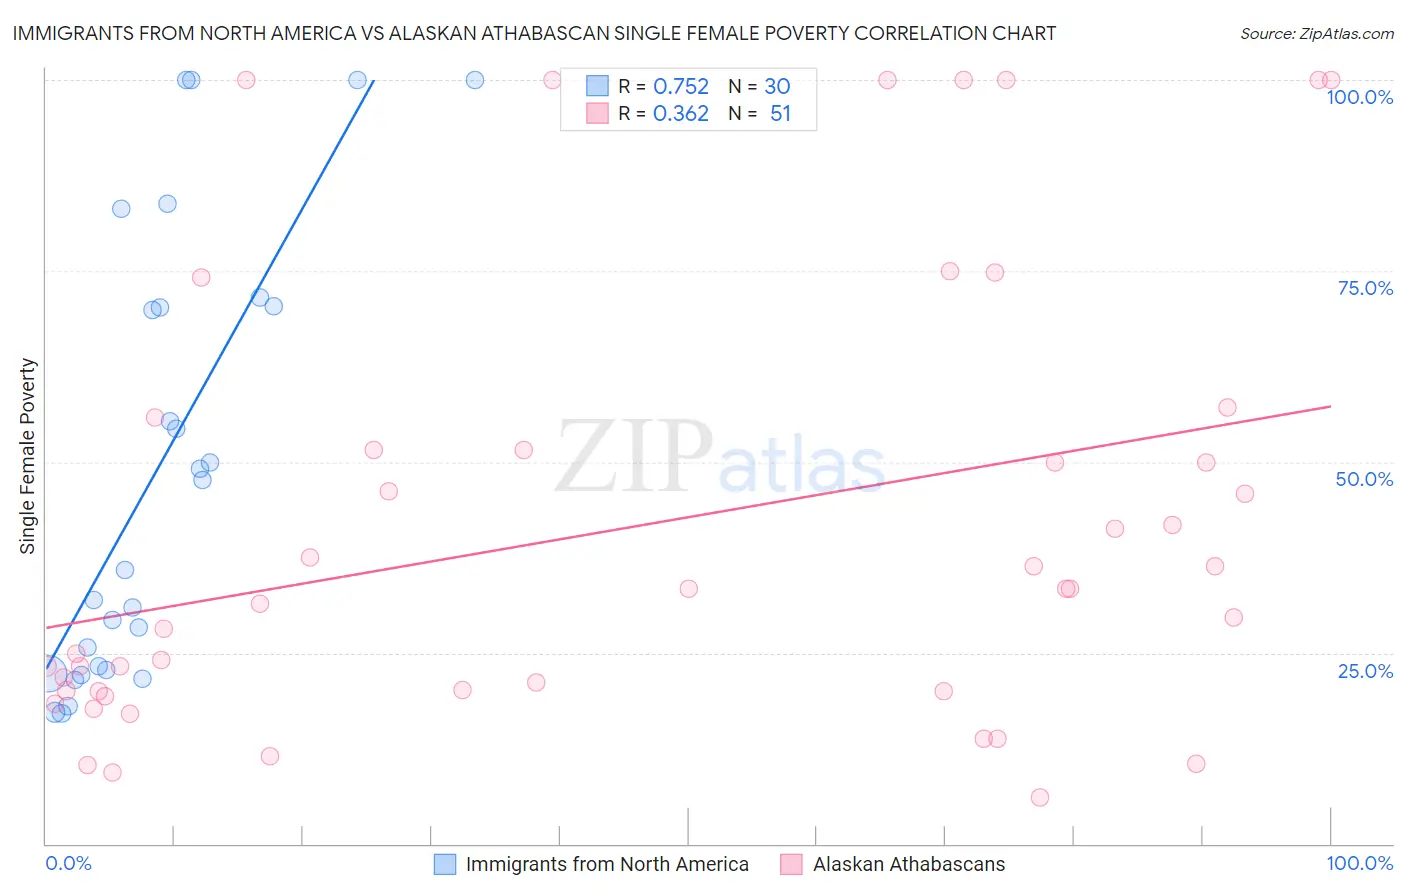
Immigrants from North America vs Alaskan Athabascan Single Female Poverty Correlation Chart
The statistical analysis conducted on geographies consisting of 451,673,972 people shows a strong positive correlation between the proportion of Immigrants from North America and poverty level among single females in the United States with a correlation coefficient (R) of 0.752 and weighted average of 20.3%. Similarly, the statistical analysis conducted on geographies consisting of 45,584,348 people shows a mild positive correlation between the proportion of Alaskan Athabascans and poverty level among single females in the United States with a correlation coefficient (R) of 0.362 and weighted average of 23.6%, a difference of 16.2%.
Single Female Poverty Correlation Summary
| Measurement | Immigrants from North America | Alaskan Athabascan |
| Minimum | 17.0% | 6.0% |
| Maximum | 100.0% | 100.0% |
| Range | 83.0% | 94.0% |
| Mean | 49.1% | 41.2% |
| Median | 41.8% | 33.3% |
| Interquartile 25% (IQ1) | 22.7% | 20.0% |
| Interquartile 75% (IQ3) | 70.4% | 51.6% |
| Interquartile Range (IQR) | 47.6% | 31.6% |
| Standard Deviation (Sample) | 28.9% | 28.9% |
| Standard Deviation (Population) | 28.4% | 28.7% |
Similar Demographics by Single Female Poverty
Demographics Similar to Immigrants from North America by Single Female Poverty
In terms of single female poverty, the demographic groups most similar to Immigrants from North America are Immigrants from Uganda (20.3%, a difference of 0.080%), Syrian (20.3%, a difference of 0.15%), Slovene (20.3%, a difference of 0.16%), Immigrants from Kuwait (20.3%, a difference of 0.16%), and Australian (20.3%, a difference of 0.19%).
| Demographics | Rating | Rank | Single Female Poverty |
| Immigrants | Venezuela | 91.5 /100 | #134 | Exceptional 20.2% |
| Immigrants | Iraq | 91.2 /100 | #135 | Exceptional 20.2% |
| Immigrants | Canada | 91.2 /100 | #136 | Exceptional 20.2% |
| Immigrants | Nepal | 90.6 /100 | #137 | Exceptional 20.3% |
| Slovenes | 90.5 /100 | #138 | Exceptional 20.3% |
| Immigrants | Kuwait | 90.4 /100 | #139 | Exceptional 20.3% |
| Syrians | 90.4 /100 | #140 | Exceptional 20.3% |
| Immigrants | North America | 89.5 /100 | #141 | Excellent 20.3% |
| Immigrants | Uganda | 89.1 /100 | #142 | Excellent 20.3% |
| Australians | 88.4 /100 | #143 | Excellent 20.3% |
| Immigrants | Uzbekistan | 88.3 /100 | #144 | Excellent 20.3% |
| Austrians | 85.8 /100 | #145 | Excellent 20.4% |
| Venezuelans | 85.5 /100 | #146 | Excellent 20.4% |
| South Africans | 85.3 /100 | #147 | Excellent 20.4% |
| Luxembourgers | 84.9 /100 | #148 | Excellent 20.4% |
Demographics Similar to Alaskan Athabascans by Single Female Poverty
In terms of single female poverty, the demographic groups most similar to Alaskan Athabascans are Nonimmigrants (23.6%, a difference of 0.040%), Pennsylvania German (23.6%, a difference of 0.11%), Immigrants from the Azores (23.5%, a difference of 0.27%), Immigrants from Latin America (23.7%, a difference of 0.49%), and Immigrants from Zaire (23.8%, a difference of 1.0%).
| Demographics | Rating | Rank | Single Female Poverty |
| Immigrants | Senegal | 0.1 /100 | #272 | Tragic 23.2% |
| Alaska Natives | 0.1 /100 | #273 | Tragic 23.3% |
| Marshallese | 0.1 /100 | #274 | Tragic 23.3% |
| Mexican American Indians | 0.1 /100 | #275 | Tragic 23.4% |
| Immigrants | Azores | 0.0 /100 | #276 | Tragic 23.5% |
| Pennsylvania Germans | 0.0 /100 | #277 | Tragic 23.6% |
| Immigrants | Nonimmigrants | 0.0 /100 | #278 | Tragic 23.6% |
| Alaskan Athabascans | 0.0 /100 | #279 | Tragic 23.6% |
| Immigrants | Latin America | 0.0 /100 | #280 | Tragic 23.7% |
| Immigrants | Zaire | 0.0 /100 | #281 | Tragic 23.8% |
| Guatemalans | 0.0 /100 | #282 | Tragic 23.8% |
| German Russians | 0.0 /100 | #283 | Tragic 23.9% |
| Immigrants | Dominica | 0.0 /100 | #284 | Tragic 23.9% |
| Immigrants | Guatemala | 0.0 /100 | #285 | Tragic 24.1% |
| Cree | 0.0 /100 | #286 | Tragic 24.1% |