Immigrants from North America vs Delaware Single Female Poverty
COMPARE
Immigrants from North America
Delaware
Single Female Poverty
Single Female Poverty Comparison
Immigrants from North America
Delaware
20.3%
SINGLE FEMALE POVERTY
89.5/ 100
METRIC RATING
141st/ 347
METRIC RANK
22.5%
SINGLE FEMALE POVERTY
1.0/ 100
METRIC RATING
252nd/ 347
METRIC RANK
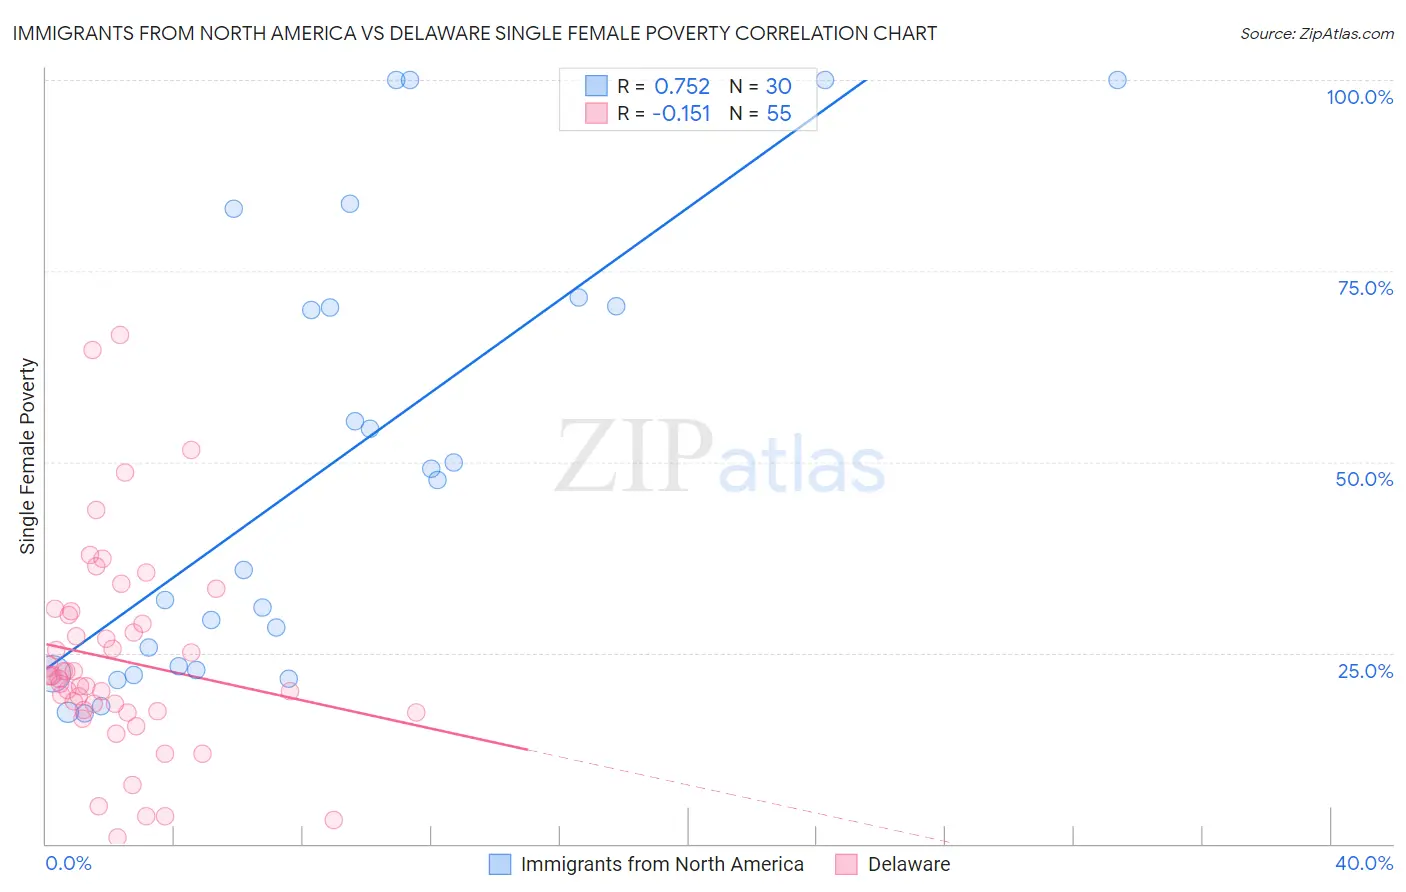
Immigrants from North America vs Delaware Single Female Poverty Correlation Chart
The statistical analysis conducted on geographies consisting of 451,673,972 people shows a strong positive correlation between the proportion of Immigrants from North America and poverty level among single females in the United States with a correlation coefficient (R) of 0.752 and weighted average of 20.3%. Similarly, the statistical analysis conducted on geographies consisting of 95,602,651 people shows a poor negative correlation between the proportion of Delaware and poverty level among single females in the United States with a correlation coefficient (R) of -0.151 and weighted average of 22.5%, a difference of 10.9%.
Single Female Poverty Correlation Summary
| Measurement | Immigrants from North America | Delaware |
| Minimum | 17.0% | 0.74% |
| Maximum | 100.0% | 66.7% |
| Range | 83.0% | 65.9% |
| Mean | 49.1% | 24.1% |
| Median | 41.8% | 22.0% |
| Interquartile 25% (IQ1) | 22.7% | 17.3% |
| Interquartile 75% (IQ3) | 70.4% | 30.0% |
| Interquartile Range (IQR) | 47.6% | 12.6% |
| Standard Deviation (Sample) | 28.9% | 13.4% |
| Standard Deviation (Population) | 28.4% | 13.2% |
Similar Demographics by Single Female Poverty
Demographics Similar to Immigrants from North America by Single Female Poverty
In terms of single female poverty, the demographic groups most similar to Immigrants from North America are Immigrants from Uganda (20.3%, a difference of 0.080%), Syrian (20.3%, a difference of 0.15%), Slovene (20.3%, a difference of 0.16%), Immigrants from Kuwait (20.3%, a difference of 0.16%), and Australian (20.3%, a difference of 0.19%).
| Demographics | Rating | Rank | Single Female Poverty |
| Immigrants | Venezuela | 91.5 /100 | #134 | Exceptional 20.2% |
| Immigrants | Iraq | 91.2 /100 | #135 | Exceptional 20.2% |
| Immigrants | Canada | 91.2 /100 | #136 | Exceptional 20.2% |
| Immigrants | Nepal | 90.6 /100 | #137 | Exceptional 20.3% |
| Slovenes | 90.5 /100 | #138 | Exceptional 20.3% |
| Immigrants | Kuwait | 90.4 /100 | #139 | Exceptional 20.3% |
| Syrians | 90.4 /100 | #140 | Exceptional 20.3% |
| Immigrants | North America | 89.5 /100 | #141 | Excellent 20.3% |
| Immigrants | Uganda | 89.1 /100 | #142 | Excellent 20.3% |
| Australians | 88.4 /100 | #143 | Excellent 20.3% |
| Immigrants | Uzbekistan | 88.3 /100 | #144 | Excellent 20.3% |
| Austrians | 85.8 /100 | #145 | Excellent 20.4% |
| Venezuelans | 85.5 /100 | #146 | Excellent 20.4% |
| South Africans | 85.3 /100 | #147 | Excellent 20.4% |
| Luxembourgers | 84.9 /100 | #148 | Excellent 20.4% |
Demographics Similar to Delaware by Single Female Poverty
In terms of single female poverty, the demographic groups most similar to Delaware are Immigrants from Liberia (22.5%, a difference of 0.090%), Immigrants from West Indies (22.5%, a difference of 0.11%), Immigrants from Burma/Myanmar (22.6%, a difference of 0.19%), Immigrants from Sudan (22.6%, a difference of 0.19%), and Immigrants from Bahamas (22.5%, a difference of 0.26%).
| Demographics | Rating | Rank | Single Female Poverty |
| Immigrants | Bangladesh | 1.8 /100 | #245 | Tragic 22.3% |
| Liberians | 1.4 /100 | #246 | Tragic 22.4% |
| Immigrants | El Salvador | 1.4 /100 | #247 | Tragic 22.4% |
| Belizeans | 1.4 /100 | #248 | Tragic 22.4% |
| Immigrants | Caribbean | 1.3 /100 | #249 | Tragic 22.4% |
| Immigrants | Bahamas | 1.2 /100 | #250 | Tragic 22.5% |
| Immigrants | West Indies | 1.0 /100 | #251 | Tragic 22.5% |
| Delaware | 1.0 /100 | #252 | Tragic 22.5% |
| Immigrants | Liberia | 0.9 /100 | #253 | Tragic 22.5% |
| Immigrants | Burma/Myanmar | 0.8 /100 | #254 | Tragic 22.6% |
| Immigrants | Sudan | 0.8 /100 | #255 | Tragic 22.6% |
| Immigrants | Belize | 0.8 /100 | #256 | Tragic 22.6% |
| Sudanese | 0.7 /100 | #257 | Tragic 22.6% |
| Bahamians | 0.6 /100 | #258 | Tragic 22.7% |
| Whites/Caucasians | 0.6 /100 | #259 | Tragic 22.7% |