Immigrants from the Azores vs Arab Single Female Poverty
COMPARE
Immigrants from the Azores
Arab
Single Female Poverty
Single Female Poverty Comparison
Immigrants from the Azores
Arabs
23.5%
SINGLE FEMALE POVERTY
0.0/ 100
METRIC RATING
276th/ 347
METRIC RANK
20.7%
SINGLE FEMALE POVERTY
70.8/ 100
METRIC RATING
160th/ 347
METRIC RANK
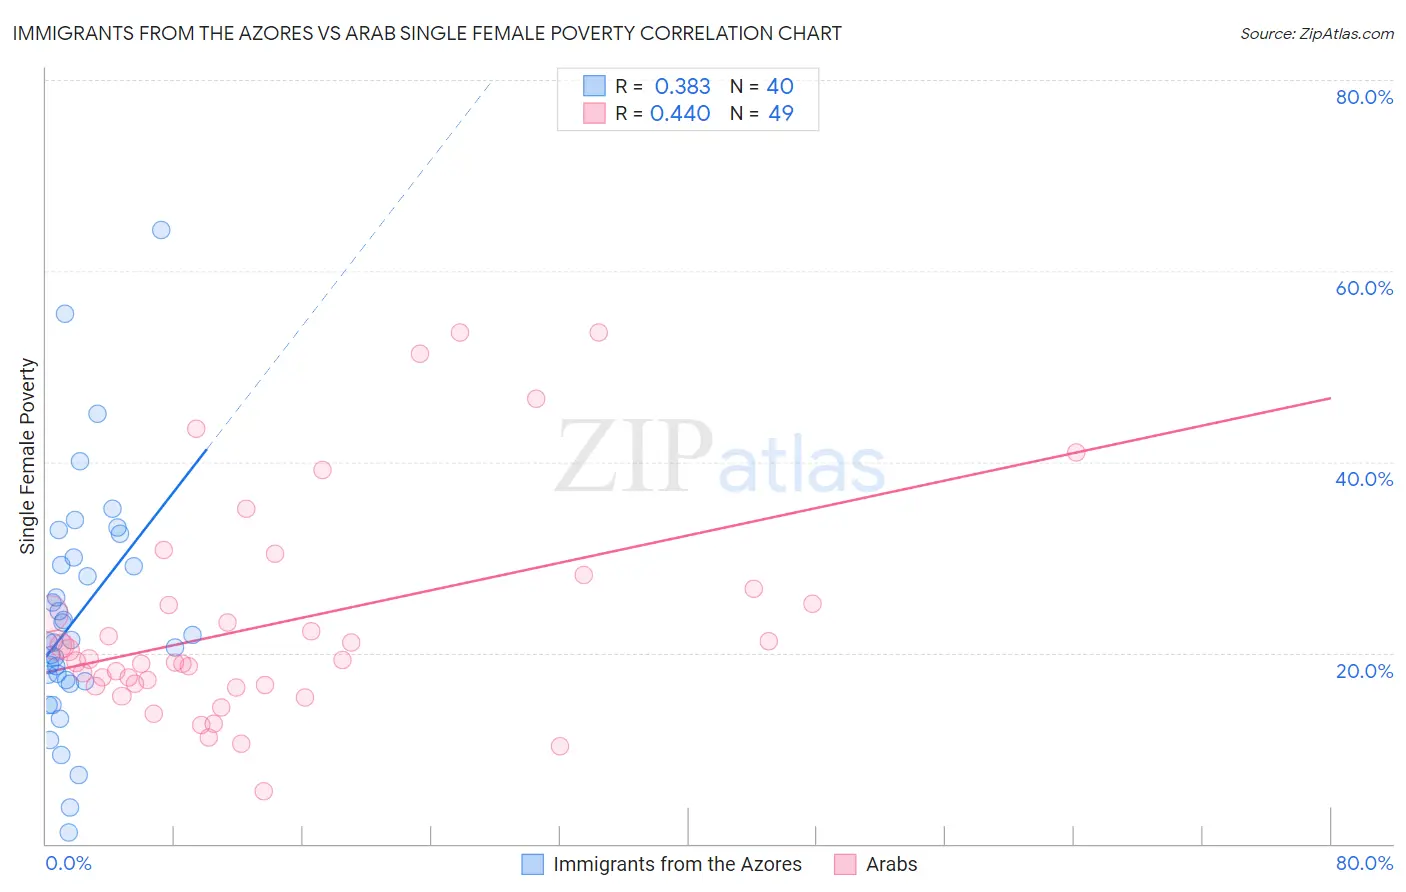
Immigrants from the Azores vs Arab Single Female Poverty Correlation Chart
The statistical analysis conducted on geographies consisting of 45,979,056 people shows a mild positive correlation between the proportion of Immigrants from the Azores and poverty level among single females in the United States with a correlation coefficient (R) of 0.383 and weighted average of 23.5%. Similarly, the statistical analysis conducted on geographies consisting of 476,036,809 people shows a moderate positive correlation between the proportion of Arabs and poverty level among single females in the United States with a correlation coefficient (R) of 0.440 and weighted average of 20.7%, a difference of 13.6%.
Single Female Poverty Correlation Summary
| Measurement | Immigrants from the Azores | Arab |
| Minimum | 1.2% | 5.5% |
| Maximum | 64.3% | 53.6% |
| Range | 63.0% | 48.1% |
| Mean | 23.9% | 23.1% |
| Median | 21.2% | 19.2% |
| Interquartile 25% (IQ1) | 17.1% | 16.6% |
| Interquartile 75% (IQ3) | 29.6% | 25.9% |
| Interquartile Range (IQR) | 12.5% | 9.4% |
| Standard Deviation (Sample) | 12.5% | 11.4% |
| Standard Deviation (Population) | 12.4% | 11.3% |
Similar Demographics by Single Female Poverty
Demographics Similar to Immigrants from the Azores by Single Female Poverty
In terms of single female poverty, the demographic groups most similar to Immigrants from the Azores are Pennsylvania German (23.6%, a difference of 0.15%), Nonimmigrants (23.6%, a difference of 0.23%), Alaskan Athabascan (23.6%, a difference of 0.27%), Immigrants from Latin America (23.7%, a difference of 0.76%), and Mexican American Indian (23.4%, a difference of 0.78%).
| Demographics | Rating | Rank | Single Female Poverty |
| Hmong | 0.2 /100 | #269 | Tragic 23.1% |
| Inupiat | 0.2 /100 | #270 | Tragic 23.1% |
| Sub-Saharan Africans | 0.1 /100 | #271 | Tragic 23.2% |
| Immigrants | Senegal | 0.1 /100 | #272 | Tragic 23.2% |
| Alaska Natives | 0.1 /100 | #273 | Tragic 23.3% |
| Marshallese | 0.1 /100 | #274 | Tragic 23.3% |
| Mexican American Indians | 0.1 /100 | #275 | Tragic 23.4% |
| Immigrants | Azores | 0.0 /100 | #276 | Tragic 23.5% |
| Pennsylvania Germans | 0.0 /100 | #277 | Tragic 23.6% |
| Immigrants | Nonimmigrants | 0.0 /100 | #278 | Tragic 23.6% |
| Alaskan Athabascans | 0.0 /100 | #279 | Tragic 23.6% |
| Immigrants | Latin America | 0.0 /100 | #280 | Tragic 23.7% |
| Immigrants | Zaire | 0.0 /100 | #281 | Tragic 23.8% |
| Guatemalans | 0.0 /100 | #282 | Tragic 23.8% |
| German Russians | 0.0 /100 | #283 | Tragic 23.9% |
Demographics Similar to Arabs by Single Female Poverty
In terms of single female poverty, the demographic groups most similar to Arabs are Costa Rican (20.7%, a difference of 0.080%), Danish (20.7%, a difference of 0.17%), Kenyan (20.8%, a difference of 0.18%), Northern European (20.8%, a difference of 0.18%), and Lebanese (20.8%, a difference of 0.24%).
| Demographics | Rating | Rank | Single Female Poverty |
| Swedes | 77.1 /100 | #153 | Good 20.6% |
| Immigrants | Western Europe | 76.7 /100 | #154 | Good 20.6% |
| Samoans | 76.0 /100 | #155 | Good 20.6% |
| South American Indians | 75.7 /100 | #156 | Good 20.6% |
| Immigrants | Oceania | 74.3 /100 | #157 | Good 20.7% |
| Danes | 73.0 /100 | #158 | Good 20.7% |
| Costa Ricans | 71.8 /100 | #159 | Good 20.7% |
| Arabs | 70.8 /100 | #160 | Good 20.7% |
| Kenyans | 68.5 /100 | #161 | Good 20.8% |
| Northern Europeans | 68.4 /100 | #162 | Good 20.8% |
| Lebanese | 67.6 /100 | #163 | Good 20.8% |
| Iraqis | 64.5 /100 | #164 | Good 20.8% |
| Ugandans | 64.0 /100 | #165 | Good 20.8% |
| Norwegians | 63.0 /100 | #166 | Good 20.8% |
| Immigrants | Norway | 63.0 /100 | #167 | Good 20.8% |