Immigrants from Guatemala vs Immigrants from Guyana Poverty
COMPARE
Immigrants from Guatemala
Immigrants from Guyana
Poverty
Poverty Comparison
Immigrants from Guatemala
Immigrants from Guyana
15.5%
POVERTY
0.0/ 100
METRIC RATING
305th/ 347
METRIC RANK
14.5%
POVERTY
0.1/ 100
METRIC RATING
265th/ 347
METRIC RANK
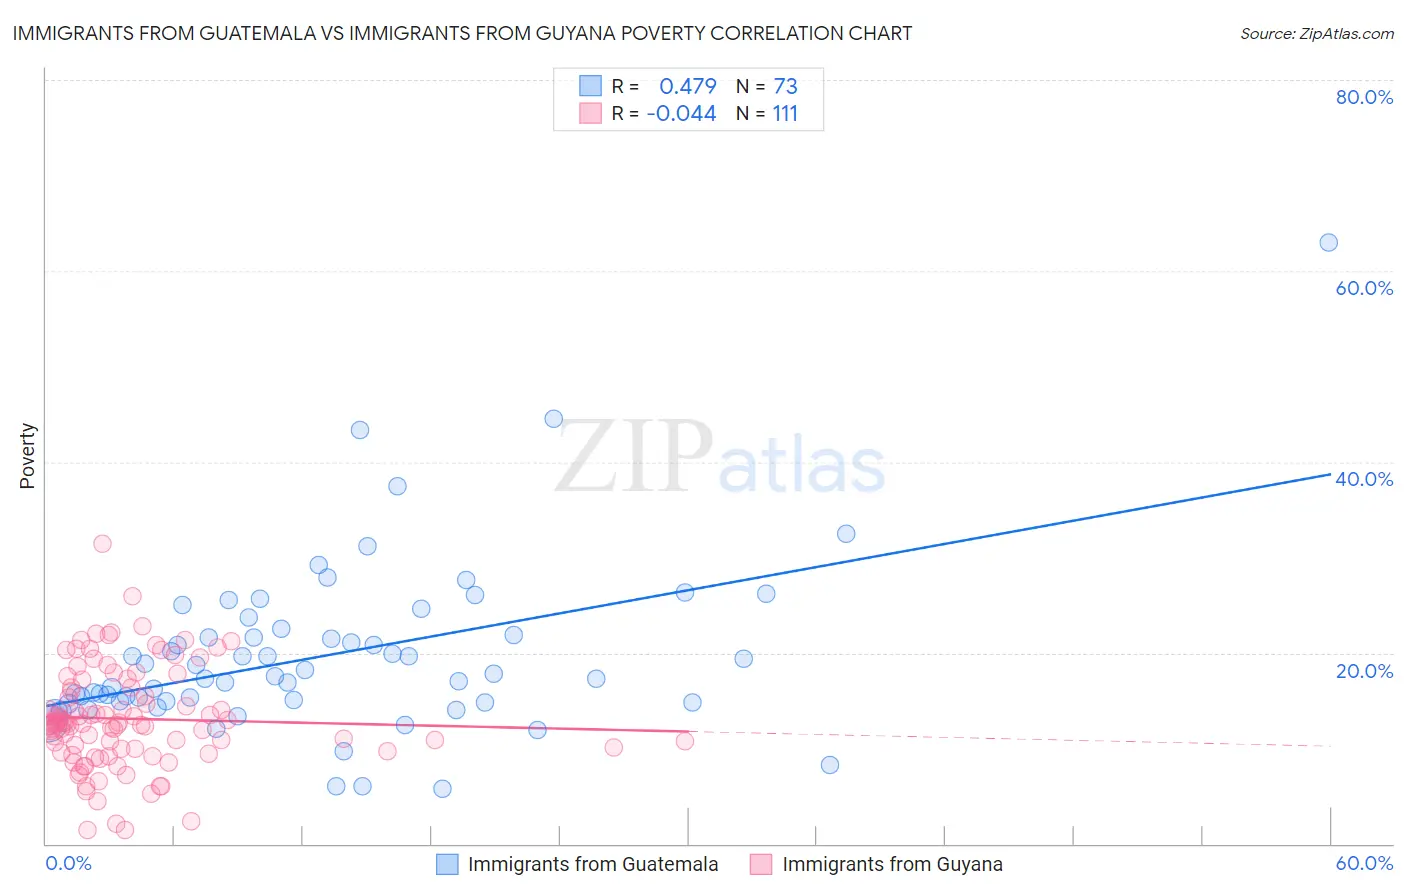
Immigrants from Guatemala vs Immigrants from Guyana Poverty Correlation Chart
The statistical analysis conducted on geographies consisting of 377,145,894 people shows a moderate positive correlation between the proportion of Immigrants from Guatemala and poverty level in the United States with a correlation coefficient (R) of 0.479 and weighted average of 15.5%. Similarly, the statistical analysis conducted on geographies consisting of 183,648,527 people shows no correlation between the proportion of Immigrants from Guyana and poverty level in the United States with a correlation coefficient (R) of -0.044 and weighted average of 14.5%, a difference of 7.2%.
Poverty Correlation Summary
| Measurement | Immigrants from Guatemala | Immigrants from Guyana |
| Minimum | 5.8% | 1.4% |
| Maximum | 62.9% | 31.4% |
| Range | 57.2% | 30.0% |
| Mean | 19.7% | 13.1% |
| Median | 17.5% | 12.6% |
| Interquartile 25% (IQ1) | 14.8% | 10.0% |
| Interquartile 75% (IQ3) | 22.2% | 16.4% |
| Interquartile Range (IQR) | 7.3% | 6.4% |
| Standard Deviation (Sample) | 8.9% | 5.3% |
| Standard Deviation (Population) | 8.9% | 5.2% |
Similar Demographics by Poverty
Demographics Similar to Immigrants from Guatemala by Poverty
In terms of poverty, the demographic groups most similar to Immigrants from Guatemala are Immigrants from Mexico (15.5%, a difference of 0.030%), Immigrants from Caribbean (15.5%, a difference of 0.12%), Creek (15.6%, a difference of 0.44%), African (15.6%, a difference of 0.51%), and Somali (15.4%, a difference of 0.61%).
| Demographics | Rating | Rank | Poverty |
| Immigrants | Senegal | 0.0 /100 | #298 | Tragic 15.3% |
| Senegalese | 0.0 /100 | #299 | Tragic 15.3% |
| Immigrants | Central America | 0.0 /100 | #300 | Tragic 15.4% |
| Bahamians | 0.0 /100 | #301 | Tragic 15.4% |
| Somalis | 0.0 /100 | #302 | Tragic 15.4% |
| Immigrants | Caribbean | 0.0 /100 | #303 | Tragic 15.5% |
| Immigrants | Mexico | 0.0 /100 | #304 | Tragic 15.5% |
| Immigrants | Guatemala | 0.0 /100 | #305 | Tragic 15.5% |
| Creek | 0.0 /100 | #306 | Tragic 15.6% |
| Africans | 0.0 /100 | #307 | Tragic 15.6% |
| Choctaw | 0.0 /100 | #308 | Tragic 15.6% |
| Seminole | 0.0 /100 | #309 | Tragic 15.6% |
| Dutch West Indians | 0.0 /100 | #310 | Tragic 15.6% |
| Chippewa | 0.0 /100 | #311 | Tragic 15.7% |
| Cajuns | 0.0 /100 | #312 | Tragic 15.7% |
Demographics Similar to Immigrants from Guyana by Poverty
In terms of poverty, the demographic groups most similar to Immigrants from Guyana are Immigrants from Jamaica (14.4%, a difference of 0.13%), Guyanese (14.5%, a difference of 0.17%), Jamaican (14.4%, a difference of 0.21%), Iroquois (14.5%, a difference of 0.49%), and Subsaharan African (14.5%, a difference of 0.52%).
| Demographics | Rating | Rank | Poverty |
| Ottawa | 0.1 /100 | #258 | Tragic 14.3% |
| Immigrants | Nicaragua | 0.1 /100 | #259 | Tragic 14.3% |
| Cape Verdeans | 0.1 /100 | #260 | Tragic 14.4% |
| Cherokee | 0.1 /100 | #261 | Tragic 14.4% |
| Immigrants | Liberia | 0.1 /100 | #262 | Tragic 14.4% |
| Jamaicans | 0.1 /100 | #263 | Tragic 14.4% |
| Immigrants | Jamaica | 0.1 /100 | #264 | Tragic 14.4% |
| Immigrants | Guyana | 0.1 /100 | #265 | Tragic 14.5% |
| Guyanese | 0.1 /100 | #266 | Tragic 14.5% |
| Iroquois | 0.1 /100 | #267 | Tragic 14.5% |
| Sub-Saharan Africans | 0.1 /100 | #268 | Tragic 14.5% |
| Immigrants | Cuba | 0.1 /100 | #269 | Tragic 14.6% |
| Central Americans | 0.1 /100 | #270 | Tragic 14.6% |
| Shoshone | 0.0 /100 | #271 | Tragic 14.7% |
| Chickasaw | 0.0 /100 | #272 | Tragic 14.7% |