Immigrants from Latvia vs Immigrants from Guyana Poverty

COMPARE

Immigrants from Latvia
Race
Ancestry
AfghanAfricanAlaska NativeAlaskan AthabascanAlbanianAleutAlsatianAmericanApacheArabArapahoArgentineanArmenianAssyrian/Chaldean/SyriacAustralianAustrianBahamianBangladeshiBarbadianBasqueBelgianBelizeanBermudanBhutaneseBlackfeetBolivianBrazilianBritishBritish West IndianBulgarianBurmeseCajunCambodianCanadianCape VerdeanCarpatho RusynCelticCentral AmericanCentral American IndianCherokeeCheyenneChickasawChileanChineseChippewaChoctawColombianColvilleComancheCosta RicanCreeCreekCroatianCrowCubanCypriotCzechCzechoslovakianDanishDelawareDominicanDutchDutch West IndianEastern EuropeanEcuadorianEgyptianEnglishEstonianEthiopianEuropeanFijianFilipinoFinnishFrenchFrench American IndianFrench CanadianGermanGerman RussianGhanaianGreekGuamanian/ChamorroGuatemalanGuyaneseHaitianHmongHonduranHopiHoumaHungarianIcelanderIndian (Asian)IndonesianInupiatIranianIraqiIrishIroquoisIsraeliItalianJamaicanJapaneseJordanianKenyanKiowaKoreanLaotianLatvianLebaneseLiberianLithuanianLumbeeLuxembourgerMacedonianMalaysianMalteseMarshalleseMenomineeMexicanMexican American IndianMongolianMoroccanNative HawaiianNavajoNepaleseNew ZealanderNicaraguanNigerianNorthern EuropeanNorwegianOkinawanOsageOttawaPaiutePakistaniPalestinianPanamanianParaguayanPennsylvania GermanPeruvianPimaPolishPortuguesePotawatomiPuebloPuerto RicanPuget Sound SalishRomanianRussianSalvadoranSamoanScandinavianScotch-IrishScottishSeminoleSenegaleseSerbianShoshoneSierra LeoneanSiouxSlavicSlovakSloveneSomaliSouth AfricanSouth AmericanSouth American IndianSoviet UnionSpaniardSpanishSpanish AmericanSpanish American IndianSri LankanSubsaharan AfricanSudaneseSwedishSwissSyrianTaiwaneseThaiTlingit-HaidaTohono O'OdhamTonganTrinidadian and TobagonianTsimshianTurkishU.S. Virgin IslanderUgandanUkrainianUruguayanUteVenezuelanVietnameseWelshWest IndianYakamaYaquiYugoslavianYumanYup'ikZimbabwean
Immigration
NonimmigrantsImmigrantsAfghanistanAfricaAlbaniaArgentinaArmeniaAsiaAustraliaAustriaBahamasBangladeshBarbadosBelarusBelgiumBelizeBoliviaBosnia and HerzegovinaBrazilBulgariaBurma/MyanmarCabo VerdeCambodiaCameroonCanadaCaribbeanCentral AmericaChileChinaColombiaCongoCosta RicaCroatiaCubaCzechoslovakiaDenmarkDominicaDominican RepublicEastern AfricaEastern AsiaEastern EuropeEcuadorEgyptEl SalvadorEnglandEritreaEthiopiaEuropeFijiFranceGermanyGhanaGreeceGrenadaGuatemalaHaitiHondurasHong KongHungaryIndiaIndonesiaIranIraqIrelandIsraelItalyJamaicaJapanJordanKazakhstanKenyaKoreaKuwaitLaosLatin AmericaLatviaLebanonLiberiaLithuaniaMalaysiaMexicoMicronesiaMiddle AfricaMoldovaMoroccoNepalNetherlandsNicaraguaNigeriaNorth AmericaNorth MacedoniaNorthern AfricaNorthern EuropeNorwayOceaniaPakistanPanamaPeruPhilippinesPolandPortugalRomaniaRussiaSaudi ArabiaScotlandSenegalSerbiaSierra LeoneSingaporeSomaliaSouth AfricaSouth AmericaSouth Central AsiaSouth Eastern AsiaSouthern EuropeSpainSri LankaSt. Vincent and the GrenadinesSudanSwedenSwitzerlandSyriaTaiwanThailandTrinidad and TobagoTurkeyUgandaUkraineUruguayUzbekistanVenezuelaVietnamWest IndiesWestern AfricaWestern AsiaWestern EuropeYemenZaireZimbabweAzores
Immigrants from Guyana
Race
Ancestry
AfghanAfricanAlaska NativeAlaskan AthabascanAlbanianAleutAlsatianAmericanApacheArabArapahoArgentineanArmenianAssyrian/Chaldean/SyriacAustralianAustrianBahamianBangladeshiBarbadianBasqueBelgianBelizeanBermudanBhutaneseBlackfeetBolivianBrazilianBritishBritish West IndianBulgarianBurmeseCajunCambodianCanadianCape VerdeanCarpatho RusynCelticCentral AmericanCentral American IndianCherokeeCheyenneChickasawChileanChineseChippewaChoctawColombianColvilleComancheCosta RicanCreeCreekCroatianCrowCubanCypriotCzechCzechoslovakianDanishDelawareDominicanDutchDutch West IndianEastern EuropeanEcuadorianEgyptianEnglishEstonianEthiopianEuropeanFijianFilipinoFinnishFrenchFrench American IndianFrench CanadianGermanGerman RussianGhanaianGreekGuamanian/ChamorroGuatemalanGuyaneseHaitianHmongHonduranHopiHoumaHungarianIcelanderIndian (Asian)IndonesianInupiatIranianIraqiIrishIroquoisIsraeliItalianJamaicanJapaneseJordanianKenyanKiowaKoreanLaotianLatvianLebaneseLiberianLithuanianLumbeeLuxembourgerMacedonianMalaysianMalteseMarshalleseMenomineeMexicanMexican American IndianMongolianMoroccanNative HawaiianNavajoNepaleseNew ZealanderNicaraguanNigerianNorthern EuropeanNorwegianOkinawanOsageOttawaPaiutePakistaniPalestinianPanamanianParaguayanPennsylvania GermanPeruvianPimaPolishPortuguesePotawatomiPuebloPuerto RicanPuget Sound SalishRomanianRussianSalvadoranSamoanScandinavianScotch-IrishScottishSeminoleSenegaleseSerbianShoshoneSierra LeoneanSiouxSlavicSlovakSloveneSomaliSouth AfricanSouth AmericanSouth American IndianSoviet UnionSpaniardSpanishSpanish AmericanSpanish American IndianSri LankanSubsaharan AfricanSudaneseSwedishSwissSyrianTaiwaneseThaiTlingit-HaidaTohono O'OdhamTonganTrinidadian and TobagonianTsimshianTurkishU.S. Virgin IslanderUgandanUkrainianUruguayanUteVenezuelanVietnameseWelshWest IndianYakamaYaquiYugoslavianYumanYup'ikZimbabwean
Immigration
NonimmigrantsImmigrantsAfghanistanAfricaAlbaniaArgentinaArmeniaAsiaAustraliaAustriaBahamasBangladeshBarbadosBelarusBelgiumBelizeBoliviaBosnia and HerzegovinaBrazilBulgariaBurma/MyanmarCabo VerdeCambodiaCameroonCanadaCaribbeanCentral AmericaChileChinaColombiaCongoCosta RicaCroatiaCubaCzechoslovakiaDenmarkDominicaDominican RepublicEastern AfricaEastern AsiaEastern EuropeEcuadorEgyptEl SalvadorEnglandEritreaEthiopiaEuropeFijiFranceGermanyGhanaGreeceGrenadaGuatemalaGuyanaHaitiHondurasHong KongHungaryIndiaIndonesiaIranIraqIrelandIsraelItalyJamaicaJapanJordanKazakhstanKenyaKoreaKuwaitLaosLatin AmericaLebanonLiberiaLithuaniaMalaysiaMexicoMicronesiaMiddle AfricaMoldovaMoroccoNepalNetherlandsNicaraguaNigeriaNorth AmericaNorth MacedoniaNorthern AfricaNorthern EuropeNorwayOceaniaPakistanPanamaPeruPhilippinesPolandPortugalRomaniaRussiaSaudi ArabiaScotlandSenegalSerbiaSierra LeoneSingaporeSomaliaSouth AfricaSouth AmericaSouth Central AsiaSouth Eastern AsiaSouthern EuropeSpainSri LankaSt. Vincent and the GrenadinesSudanSwedenSwitzerlandSyriaTaiwanThailandTrinidad and TobagoTurkeyUgandaUkraineUruguayUzbekistanVenezuelaVietnamWest IndiesWestern AfricaWestern AsiaWestern EuropeYemenZaireZimbabweAzores
Poverty
Income
Poverty
Unemployment
Labor Participation
Family Structure
Vehicle Availability
Education Level
Disability

Poverty Comparison

Immigrants from Latvia

Immigrants from Guyana

Exceptional
Tragic
11.5%
POVERTY
94.5/ 100
METRIC RATING
98th/ 347
METRIC RANK
14.5%
POVERTY
0.1/ 100
METRIC RATING
265th/ 347
METRIC RANK

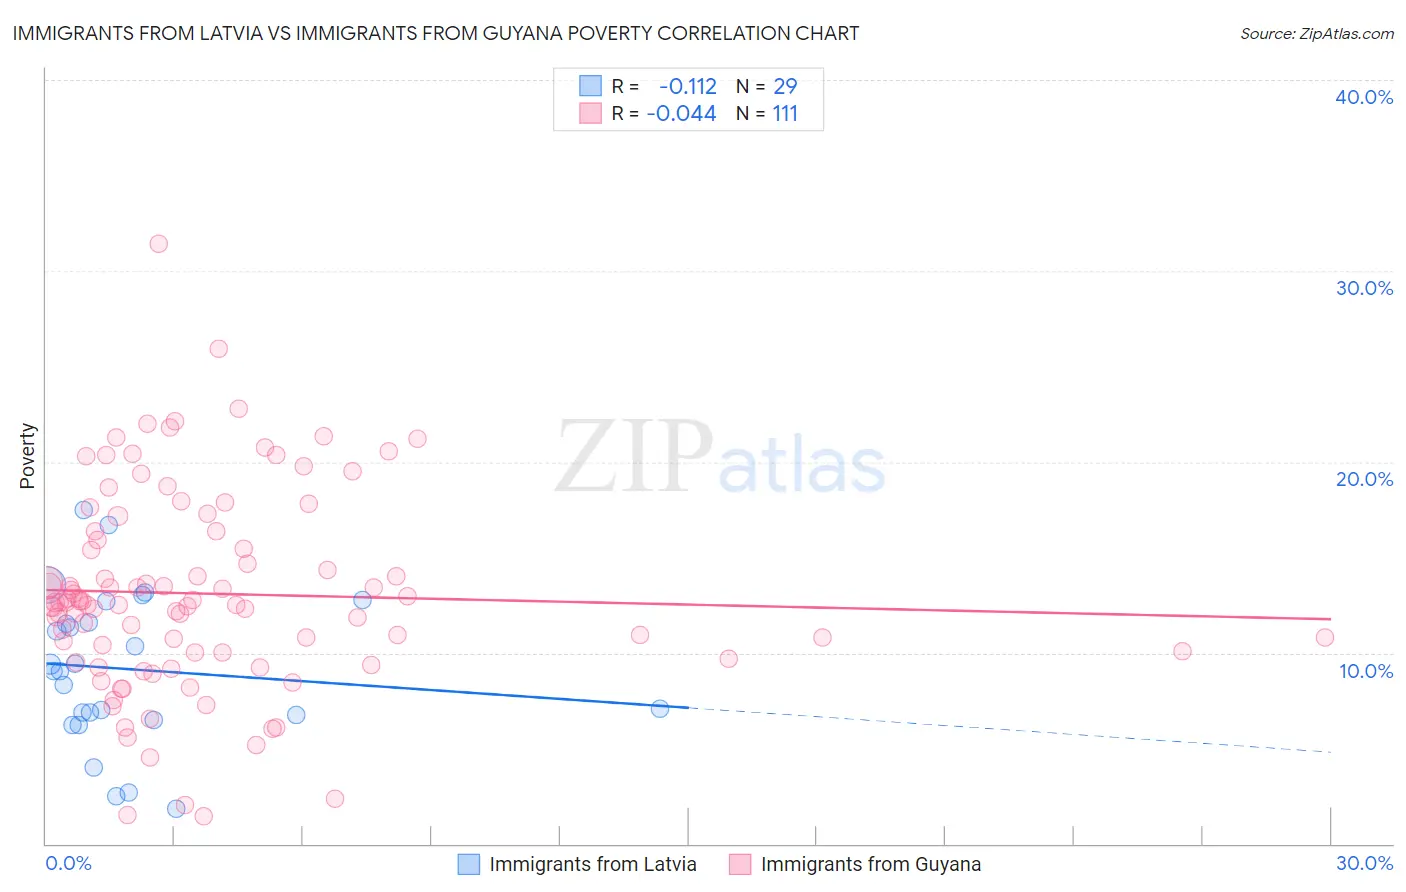
Immigrants from Latvia vs Immigrants from Guyana Poverty Correlation Chart

The statistical analysis conducted on geographies consisting of 113,731,697 people shows a poor negative correlation between the proportion of Immigrants from Latvia and poverty level in the United States with a correlation coefficient (R) of -0.112 and weighted average of 11.5%. Similarly, the statistical analysis conducted on geographies consisting of 183,648,527 people shows no correlation between the proportion of Immigrants from Guyana and poverty level in the United States with a correlation coefficient (R) of -0.044 and weighted average of 14.5%, a difference of 26.1%.
Immigrants from Latvia vs Immigrants from Guyana Poverty

Poverty Correlation Summary

MeasurementImmigrants from LatviaImmigrants from Guyana
Minimum1.8%1.4%
Maximum17.5%31.4%
Range15.6%30.0%
Mean9.1%13.1%
Median9.1%12.6%
Interquartile 25% (IQ1)6.6%10.0%
Interquartile 75% (IQ3)12.2%16.4%
Interquartile Range (IQR)5.6%6.4%
Standard Deviation (Sample)4.0%5.3%
Standard Deviation (Population)3.9%5.2%

Similar Demographics by Poverty

Demographics Similar to Immigrants from Latvia by Poverty

In terms of poverty, the demographic groups most similar to Immigrants from Latvia are Immigrants from Egypt (11.5%, a difference of 0.030%), Immigrants from South Africa (11.5%, a difference of 0.070%), Immigrants from Indonesia (11.5%, a difference of 0.14%), Paraguayan (11.4%, a difference of 0.19%), and Australian (11.4%, a difference of 0.19%).
DemographicsRating | RankPoverty
Finns
95.2
/100
|
#91
Exceptional
11.4%
British
95.0
/100
|
#92
Exceptional
11.4%
Romanians
94.9
/100
|
#93
Exceptional
11.4%
Paraguayans
94.9
/100
|
#94
Exceptional
11.4%
Australians
94.9
/100
|
#95
Exceptional
11.4%
Immigrants | South Africa
94.7
/100
|
#96
Exceptional
11.5%
Immigrants | Egypt
94.6
/100
|
#97
Exceptional
11.5%
Immigrants | Latvia
94.5
/100
|
#98
Exceptional
11.5%
Immigrants | Indonesia
94.2
/100
|
#99
Exceptional
11.5%
Scottish
94.0
/100
|
#100
Exceptional
11.5%
Slavs
93.3
/100
|
#101
Exceptional
11.5%
Laotians
92.4
/100
|
#102
Exceptional
11.6%
Okinawans
92.4
/100
|
#103
Exceptional
11.6%
Native Hawaiians
92.1
/100
|
#104
Exceptional
11.6%
Portuguese
92.1
/100
|
#105
Exceptional
11.6%

Demographics Similar to Immigrants from Guyana by Poverty

In terms of poverty, the demographic groups most similar to Immigrants from Guyana are Immigrants from Jamaica (14.4%, a difference of 0.13%), Guyanese (14.5%, a difference of 0.17%), Jamaican (14.4%, a difference of 0.21%), Iroquois (14.5%, a difference of 0.49%), and Subsaharan African (14.5%, a difference of 0.52%).
DemographicsRating | RankPoverty
Ottawa
0.1
/100
|
#258
Tragic
14.3%
Immigrants | Nicaragua
0.1
/100
|
#259
Tragic
14.3%
Cape Verdeans
0.1
/100
|
#260
Tragic
14.4%
Cherokee
0.1
/100
|
#261
Tragic
14.4%
Immigrants | Liberia
0.1
/100
|
#262
Tragic
14.4%
Jamaicans
0.1
/100
|
#263
Tragic
14.4%
Immigrants | Jamaica
0.1
/100
|
#264
Tragic
14.4%
Immigrants | Guyana
0.1
/100
|
#265
Tragic
14.5%
Guyanese
0.1
/100
|
#266
Tragic
14.5%
Iroquois
0.1
/100
|
#267
Tragic
14.5%
Sub-Saharan Africans
0.1
/100
|
#268
Tragic
14.5%
Immigrants | Cuba
0.1
/100
|
#269
Tragic
14.6%
Central Americans
0.1
/100
|
#270
Tragic
14.6%
Shoshone
0.0
/100
|
#271
Tragic
14.7%
Chickasaw
0.0
/100
|
#272
Tragic
14.7%