Immigrants from Philippines vs Immigrants from Guyana Poverty
COMPARE
Immigrants from Philippines
Immigrants from Guyana
Poverty
Poverty Comparison
Immigrants from Philippines
Immigrants from Guyana
11.0%
POVERTY
98.7/ 100
METRIC RATING
52nd/ 347
METRIC RANK
14.5%
POVERTY
0.1/ 100
METRIC RATING
265th/ 347
METRIC RANK
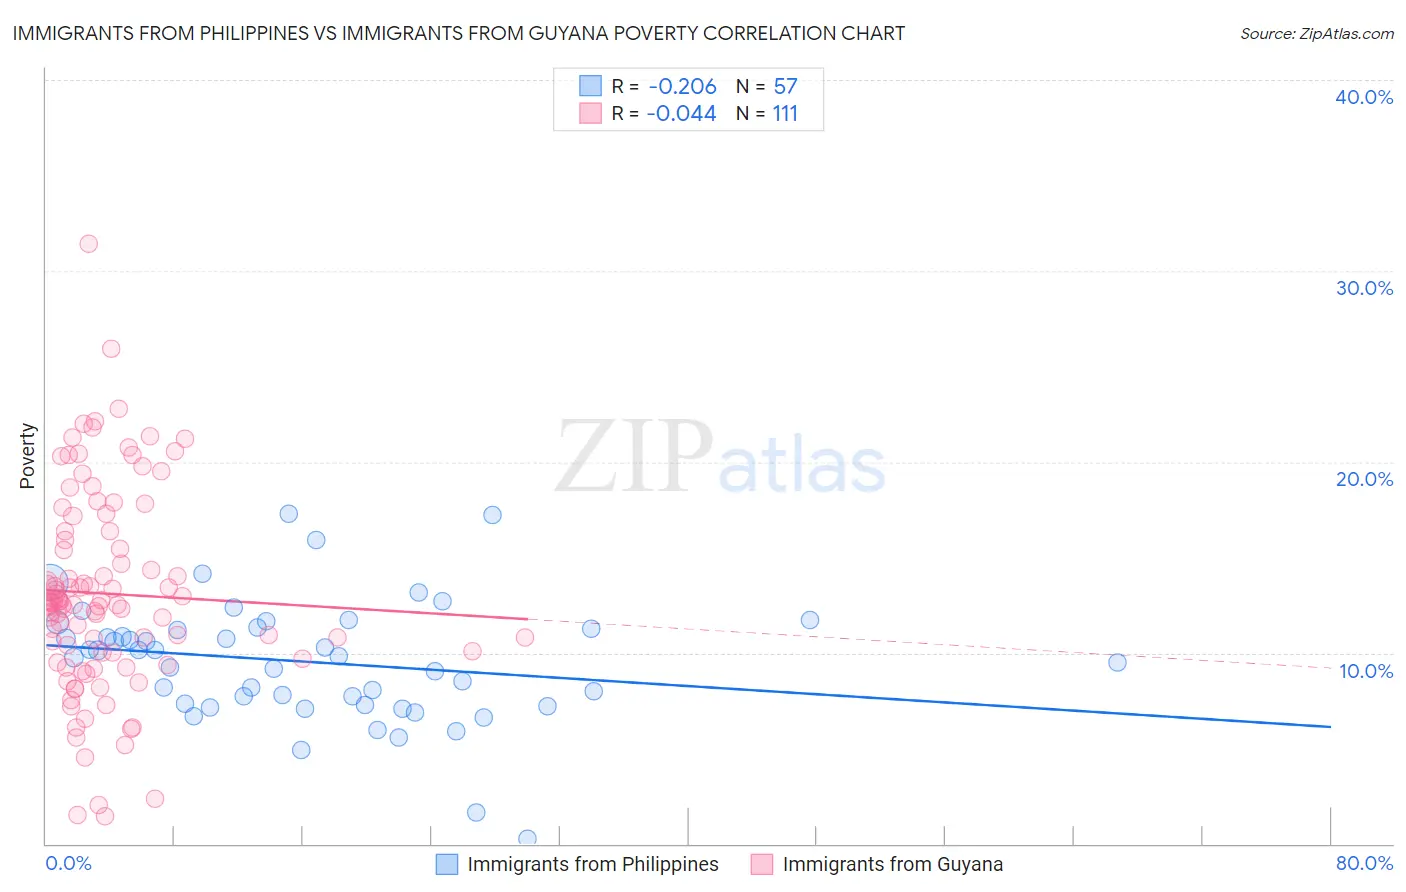
Immigrants from Philippines vs Immigrants from Guyana Poverty Correlation Chart
The statistical analysis conducted on geographies consisting of 471,023,634 people shows a weak negative correlation between the proportion of Immigrants from Philippines and poverty level in the United States with a correlation coefficient (R) of -0.206 and weighted average of 11.0%. Similarly, the statistical analysis conducted on geographies consisting of 183,648,527 people shows no correlation between the proportion of Immigrants from Guyana and poverty level in the United States with a correlation coefficient (R) of -0.044 and weighted average of 14.5%, a difference of 31.1%.
Poverty Correlation Summary
| Measurement | Immigrants from Philippines | Immigrants from Guyana |
| Minimum | 0.27% | 1.4% |
| Maximum | 17.3% | 31.4% |
| Range | 17.0% | 30.0% |
| Mean | 9.5% | 13.1% |
| Median | 9.9% | 12.6% |
| Interquartile 25% (IQ1) | 7.3% | 10.0% |
| Interquartile 75% (IQ3) | 11.3% | 16.4% |
| Interquartile Range (IQR) | 4.0% | 6.4% |
| Standard Deviation (Sample) | 3.2% | 5.3% |
| Standard Deviation (Population) | 3.1% | 5.2% |
Similar Demographics by Poverty
Demographics Similar to Immigrants from Philippines by Poverty
In terms of poverty, the demographic groups most similar to Immigrants from Philippines are Immigrants from Croatia (11.0%, a difference of 0.020%), Immigrants from Austria (11.1%, a difference of 0.23%), Immigrants from Bulgaria (11.1%, a difference of 0.34%), Immigrants from Serbia (11.1%, a difference of 0.37%), and Asian (11.0%, a difference of 0.42%).
| Demographics | Rating | Rank | Poverty |
| Turks | 98.9 /100 | #45 | Exceptional 11.0% |
| Immigrants | Czechoslovakia | 98.9 /100 | #46 | Exceptional 11.0% |
| Immigrants | Romania | 98.9 /100 | #47 | Exceptional 11.0% |
| Slovenes | 98.9 /100 | #48 | Exceptional 11.0% |
| Immigrants | Japan | 98.9 /100 | #49 | Exceptional 11.0% |
| Asians | 98.9 /100 | #50 | Exceptional 11.0% |
| Immigrants | Croatia | 98.7 /100 | #51 | Exceptional 11.0% |
| Immigrants | Philippines | 98.7 /100 | #52 | Exceptional 11.0% |
| Immigrants | Austria | 98.6 /100 | #53 | Exceptional 11.1% |
| Immigrants | Bulgaria | 98.5 /100 | #54 | Exceptional 11.1% |
| Immigrants | Serbia | 98.5 /100 | #55 | Exceptional 11.1% |
| Estonians | 98.2 /100 | #56 | Exceptional 11.1% |
| Scandinavians | 98.2 /100 | #57 | Exceptional 11.1% |
| Germans | 98.1 /100 | #58 | Exceptional 11.1% |
| Immigrants | Europe | 98.0 /100 | #59 | Exceptional 11.2% |
Demographics Similar to Immigrants from Guyana by Poverty
In terms of poverty, the demographic groups most similar to Immigrants from Guyana are Immigrants from Jamaica (14.4%, a difference of 0.13%), Guyanese (14.5%, a difference of 0.17%), Jamaican (14.4%, a difference of 0.21%), Iroquois (14.5%, a difference of 0.49%), and Subsaharan African (14.5%, a difference of 0.52%).
| Demographics | Rating | Rank | Poverty |
| Ottawa | 0.1 /100 | #258 | Tragic 14.3% |
| Immigrants | Nicaragua | 0.1 /100 | #259 | Tragic 14.3% |
| Cape Verdeans | 0.1 /100 | #260 | Tragic 14.4% |
| Cherokee | 0.1 /100 | #261 | Tragic 14.4% |
| Immigrants | Liberia | 0.1 /100 | #262 | Tragic 14.4% |
| Jamaicans | 0.1 /100 | #263 | Tragic 14.4% |
| Immigrants | Jamaica | 0.1 /100 | #264 | Tragic 14.4% |
| Immigrants | Guyana | 0.1 /100 | #265 | Tragic 14.5% |
| Guyanese | 0.1 /100 | #266 | Tragic 14.5% |
| Iroquois | 0.1 /100 | #267 | Tragic 14.5% |
| Sub-Saharan Africans | 0.1 /100 | #268 | Tragic 14.5% |
| Immigrants | Cuba | 0.1 /100 | #269 | Tragic 14.6% |
| Central Americans | 0.1 /100 | #270 | Tragic 14.6% |
| Shoshone | 0.0 /100 | #271 | Tragic 14.7% |
| Chickasaw | 0.0 /100 | #272 | Tragic 14.7% |