Immigrants from Middle Africa vs Immigrants from Grenada Poverty
COMPARE
Immigrants from Middle Africa
Immigrants from Grenada
Poverty
Poverty Comparison
Immigrants from Middle Africa
Immigrants from Grenada
14.0%
POVERTY
0.4/ 100
METRIC RATING
240th/ 347
METRIC RANK
15.8%
POVERTY
0.0/ 100
METRIC RATING
313th/ 347
METRIC RANK
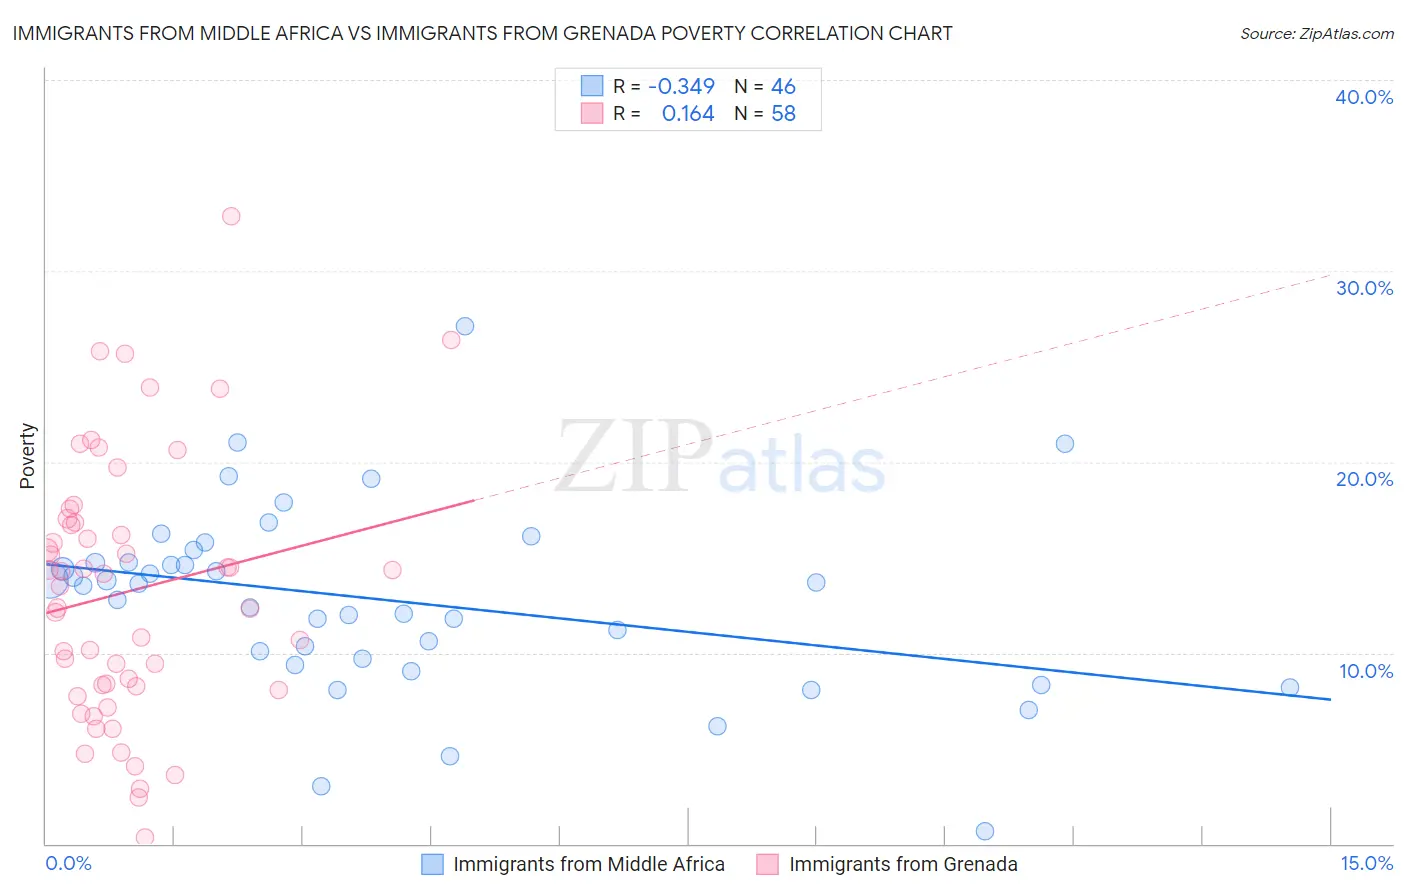
Immigrants from Middle Africa vs Immigrants from Grenada Poverty Correlation Chart
The statistical analysis conducted on geographies consisting of 202,643,852 people shows a mild negative correlation between the proportion of Immigrants from Middle Africa and poverty level in the United States with a correlation coefficient (R) of -0.349 and weighted average of 14.0%. Similarly, the statistical analysis conducted on geographies consisting of 67,200,374 people shows a poor positive correlation between the proportion of Immigrants from Grenada and poverty level in the United States with a correlation coefficient (R) of 0.164 and weighted average of 15.8%, a difference of 13.0%.
Poverty Correlation Summary
| Measurement | Immigrants from Middle Africa | Immigrants from Grenada |
| Minimum | 0.62% | 0.33% |
| Maximum | 27.1% | 32.9% |
| Range | 26.5% | 32.6% |
| Mean | 12.8% | 13.2% |
| Median | 13.6% | 13.8% |
| Interquartile 25% (IQ1) | 9.7% | 8.2% |
| Interquartile 75% (IQ3) | 14.7% | 16.8% |
| Interquartile Range (IQR) | 5.0% | 8.6% |
| Standard Deviation (Sample) | 4.9% | 6.8% |
| Standard Deviation (Population) | 4.8% | 6.8% |
Similar Demographics by Poverty
Demographics Similar to Immigrants from Middle Africa by Poverty
In terms of poverty, the demographic groups most similar to Immigrants from Middle Africa are Salvadoran (14.0%, a difference of 0.020%), Nicaraguan (13.9%, a difference of 0.12%), Ecuadorian (14.0%, a difference of 0.34%), Sudanese (14.0%, a difference of 0.41%), and Nepalese (14.0%, a difference of 0.44%).
| Demographics | Rating | Rank | Poverty |
| Immigrants | Saudi Arabia | 0.8 /100 | #233 | Tragic 13.8% |
| Immigrants | Laos | 0.7 /100 | #234 | Tragic 13.8% |
| Cubans | 0.6 /100 | #235 | Tragic 13.9% |
| Immigrants | Armenia | 0.5 /100 | #236 | Tragic 13.9% |
| French American Indians | 0.5 /100 | #237 | Tragic 13.9% |
| Ghanaians | 0.5 /100 | #238 | Tragic 13.9% |
| Nicaraguans | 0.4 /100 | #239 | Tragic 13.9% |
| Immigrants | Middle Africa | 0.4 /100 | #240 | Tragic 14.0% |
| Salvadorans | 0.4 /100 | #241 | Tragic 14.0% |
| Ecuadorians | 0.4 /100 | #242 | Tragic 14.0% |
| Sudanese | 0.3 /100 | #243 | Tragic 14.0% |
| Nepalese | 0.3 /100 | #244 | Tragic 14.0% |
| Immigrants | Sudan | 0.3 /100 | #245 | Tragic 14.1% |
| Potawatomi | 0.3 /100 | #246 | Tragic 14.1% |
| Liberians | 0.2 /100 | #247 | Tragic 14.1% |
Demographics Similar to Immigrants from Grenada by Poverty
In terms of poverty, the demographic groups most similar to Immigrants from Grenada are Immigrants from Somalia (15.8%, a difference of 0.12%), Cajun (15.7%, a difference of 0.44%), British West Indian (15.9%, a difference of 0.49%), Honduran (15.9%, a difference of 0.49%), and Chippewa (15.7%, a difference of 0.60%).
| Demographics | Rating | Rank | Poverty |
| Creek | 0.0 /100 | #306 | Tragic 15.6% |
| Africans | 0.0 /100 | #307 | Tragic 15.6% |
| Choctaw | 0.0 /100 | #308 | Tragic 15.6% |
| Seminole | 0.0 /100 | #309 | Tragic 15.6% |
| Dutch West Indians | 0.0 /100 | #310 | Tragic 15.6% |
| Chippewa | 0.0 /100 | #311 | Tragic 15.7% |
| Cajuns | 0.0 /100 | #312 | Tragic 15.7% |
| Immigrants | Grenada | 0.0 /100 | #313 | Tragic 15.8% |
| Immigrants | Somalia | 0.0 /100 | #314 | Tragic 15.8% |
| British West Indians | 0.0 /100 | #315 | Tragic 15.9% |
| Hondurans | 0.0 /100 | #316 | Tragic 15.9% |
| U.S. Virgin Islanders | 0.0 /100 | #317 | Tragic 16.1% |
| Immigrants | Dominica | 0.0 /100 | #318 | Tragic 16.1% |
| Immigrants | Congo | 0.0 /100 | #319 | Tragic 16.1% |
| Immigrants | Honduras | 0.0 /100 | #320 | Tragic 16.2% |