Greek vs Immigrants from Guyana Poverty
COMPARE
Greek
Immigrants from Guyana
Poverty
Poverty Comparison
Greeks
Immigrants from Guyana
10.7%
POVERTY
99.5/ 100
METRIC RATING
29th/ 347
METRIC RANK
14.5%
POVERTY
0.1/ 100
METRIC RATING
265th/ 347
METRIC RANK
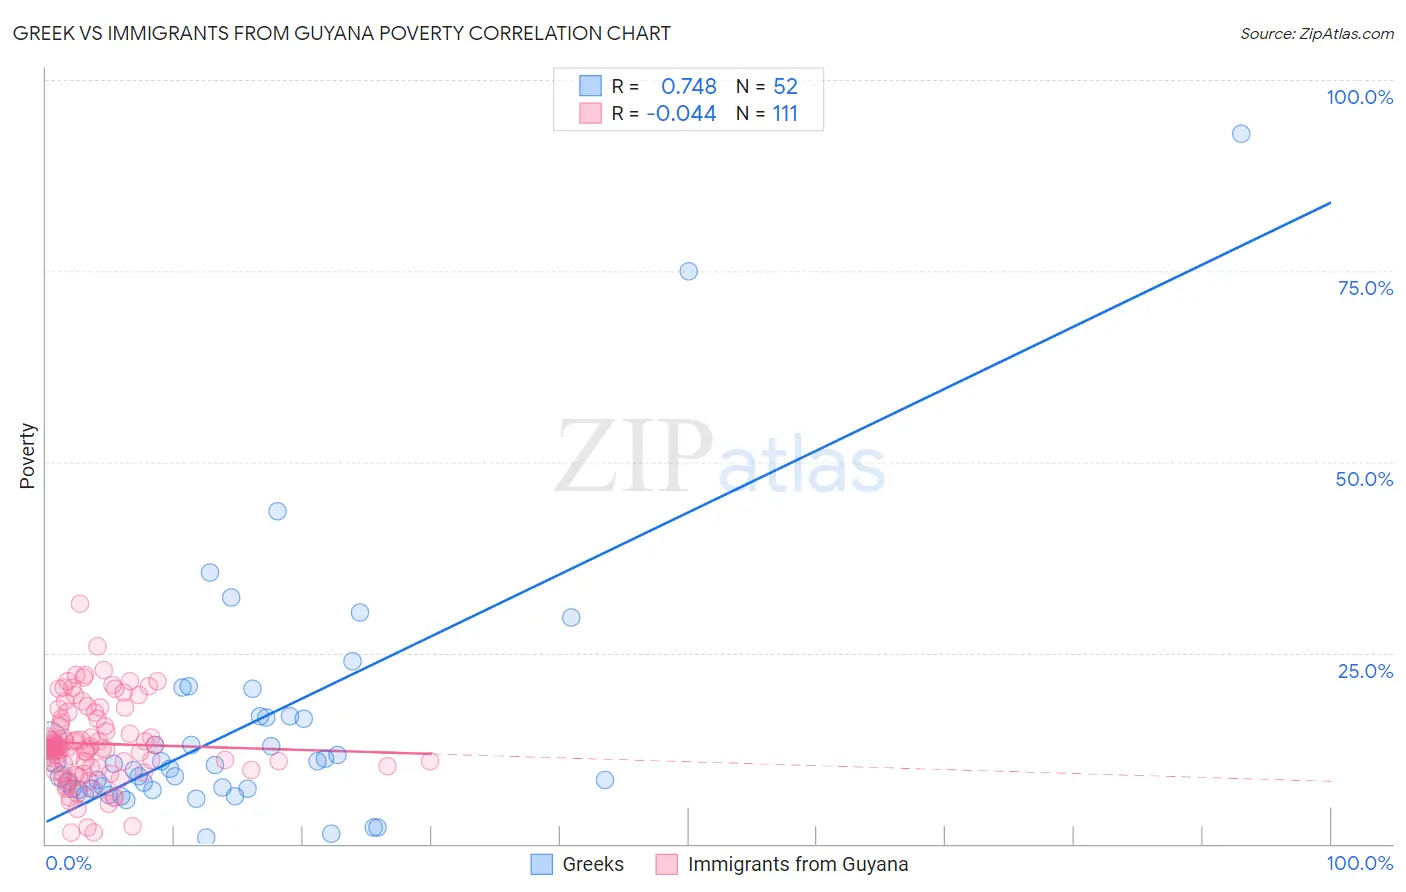
Greek vs Immigrants from Guyana Poverty Correlation Chart
The statistical analysis conducted on geographies consisting of 482,333,537 people shows a strong positive correlation between the proportion of Greeks and poverty level in the United States with a correlation coefficient (R) of 0.748 and weighted average of 10.7%. Similarly, the statistical analysis conducted on geographies consisting of 183,648,527 people shows no correlation between the proportion of Immigrants from Guyana and poverty level in the United States with a correlation coefficient (R) of -0.044 and weighted average of 14.5%, a difference of 34.8%.
Poverty Correlation Summary
| Measurement | Greek | Immigrants from Guyana |
| Minimum | 0.75% | 1.4% |
| Maximum | 93.0% | 31.4% |
| Range | 92.3% | 30.0% |
| Mean | 15.2% | 13.1% |
| Median | 10.1% | 12.6% |
| Interquartile 25% (IQ1) | 7.2% | 10.0% |
| Interquartile 75% (IQ3) | 16.6% | 16.4% |
| Interquartile Range (IQR) | 9.4% | 6.4% |
| Standard Deviation (Sample) | 16.5% | 5.3% |
| Standard Deviation (Population) | 16.4% | 5.2% |
Similar Demographics by Poverty
Demographics Similar to Greeks by Poverty
In terms of poverty, the demographic groups most similar to Greeks are Danish (10.7%, a difference of 0.010%), Immigrants from Korea (10.7%, a difference of 0.090%), Polish (10.7%, a difference of 0.090%), Immigrants from Northern Europe (10.7%, a difference of 0.16%), and Iranian (10.7%, a difference of 0.18%).
| Demographics | Rating | Rank | Poverty |
| Eastern Europeans | 99.7 /100 | #22 | Exceptional 10.6% |
| Swedes | 99.7 /100 | #23 | Exceptional 10.6% |
| Italians | 99.7 /100 | #24 | Exceptional 10.6% |
| Croatians | 99.6 /100 | #25 | Exceptional 10.6% |
| Burmese | 99.6 /100 | #26 | Exceptional 10.7% |
| Immigrants | Northern Europe | 99.6 /100 | #27 | Exceptional 10.7% |
| Immigrants | Korea | 99.5 /100 | #28 | Exceptional 10.7% |
| Greeks | 99.5 /100 | #29 | Exceptional 10.7% |
| Danes | 99.5 /100 | #30 | Exceptional 10.7% |
| Poles | 99.5 /100 | #31 | Exceptional 10.7% |
| Iranians | 99.5 /100 | #32 | Exceptional 10.7% |
| Macedonians | 99.4 /100 | #33 | Exceptional 10.8% |
| Immigrants | Poland | 99.4 /100 | #34 | Exceptional 10.8% |
| Tongans | 99.4 /100 | #35 | Exceptional 10.8% |
| Cypriots | 99.3 /100 | #36 | Exceptional 10.8% |
Demographics Similar to Immigrants from Guyana by Poverty
In terms of poverty, the demographic groups most similar to Immigrants from Guyana are Immigrants from Jamaica (14.4%, a difference of 0.13%), Guyanese (14.5%, a difference of 0.17%), Jamaican (14.4%, a difference of 0.21%), Iroquois (14.5%, a difference of 0.49%), and Subsaharan African (14.5%, a difference of 0.52%).
| Demographics | Rating | Rank | Poverty |
| Ottawa | 0.1 /100 | #258 | Tragic 14.3% |
| Immigrants | Nicaragua | 0.1 /100 | #259 | Tragic 14.3% |
| Cape Verdeans | 0.1 /100 | #260 | Tragic 14.4% |
| Cherokee | 0.1 /100 | #261 | Tragic 14.4% |
| Immigrants | Liberia | 0.1 /100 | #262 | Tragic 14.4% |
| Jamaicans | 0.1 /100 | #263 | Tragic 14.4% |
| Immigrants | Jamaica | 0.1 /100 | #264 | Tragic 14.4% |
| Immigrants | Guyana | 0.1 /100 | #265 | Tragic 14.5% |
| Guyanese | 0.1 /100 | #266 | Tragic 14.5% |
| Iroquois | 0.1 /100 | #267 | Tragic 14.5% |
| Sub-Saharan Africans | 0.1 /100 | #268 | Tragic 14.5% |
| Immigrants | Cuba | 0.1 /100 | #269 | Tragic 14.6% |
| Central Americans | 0.1 /100 | #270 | Tragic 14.6% |
| Shoshone | 0.0 /100 | #271 | Tragic 14.7% |
| Chickasaw | 0.0 /100 | #272 | Tragic 14.7% |