Immigrants from Middle Africa vs Pueblo Poverty
COMPARE
Immigrants from Middle Africa
Pueblo
Poverty
Poverty Comparison
Immigrants from Middle Africa
Pueblo
14.0%
POVERTY
0.4/ 100
METRIC RATING
240th/ 347
METRIC RANK
19.4%
POVERTY
0.0/ 100
METRIC RATING
336th/ 347
METRIC RANK
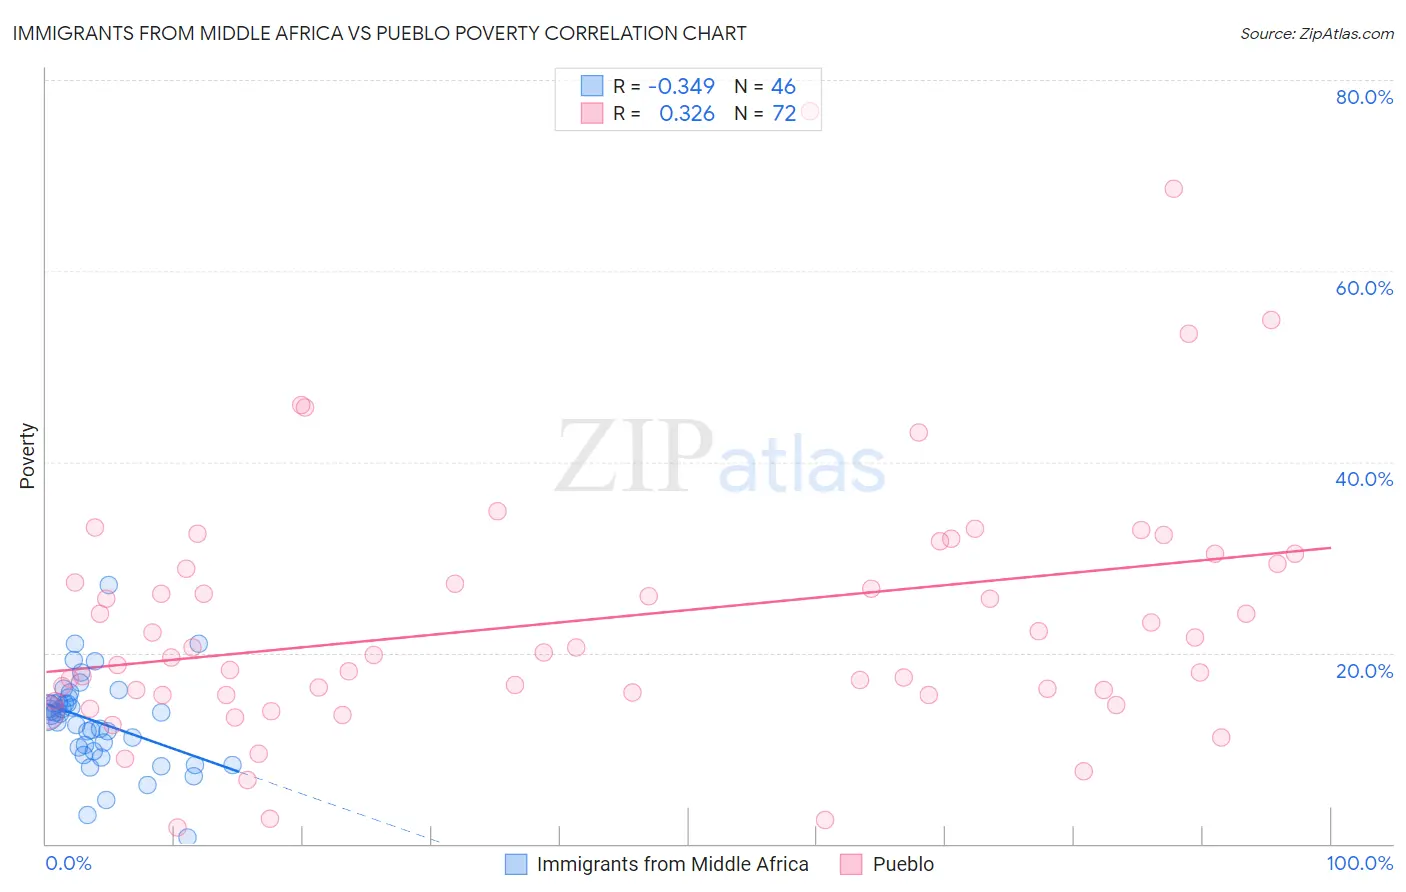
Immigrants from Middle Africa vs Pueblo Poverty Correlation Chart
The statistical analysis conducted on geographies consisting of 202,643,852 people shows a mild negative correlation between the proportion of Immigrants from Middle Africa and poverty level in the United States with a correlation coefficient (R) of -0.349 and weighted average of 14.0%. Similarly, the statistical analysis conducted on geographies consisting of 120,076,911 people shows a mild positive correlation between the proportion of Pueblo and poverty level in the United States with a correlation coefficient (R) of 0.326 and weighted average of 19.4%, a difference of 39.1%.
Poverty Correlation Summary
| Measurement | Immigrants from Middle Africa | Pueblo |
| Minimum | 0.62% | 1.7% |
| Maximum | 27.1% | 76.8% |
| Range | 26.5% | 75.1% |
| Mean | 12.8% | 23.4% |
| Median | 13.6% | 19.9% |
| Interquartile 25% (IQ1) | 9.7% | 15.6% |
| Interquartile 75% (IQ3) | 14.7% | 29.0% |
| Interquartile Range (IQR) | 5.0% | 13.4% |
| Standard Deviation (Sample) | 4.9% | 13.6% |
| Standard Deviation (Population) | 4.8% | 13.5% |
Similar Demographics by Poverty
Demographics Similar to Immigrants from Middle Africa by Poverty
In terms of poverty, the demographic groups most similar to Immigrants from Middle Africa are Salvadoran (14.0%, a difference of 0.020%), Nicaraguan (13.9%, a difference of 0.12%), Ecuadorian (14.0%, a difference of 0.34%), Sudanese (14.0%, a difference of 0.41%), and Nepalese (14.0%, a difference of 0.44%).
| Demographics | Rating | Rank | Poverty |
| Immigrants | Saudi Arabia | 0.8 /100 | #233 | Tragic 13.8% |
| Immigrants | Laos | 0.7 /100 | #234 | Tragic 13.8% |
| Cubans | 0.6 /100 | #235 | Tragic 13.9% |
| Immigrants | Armenia | 0.5 /100 | #236 | Tragic 13.9% |
| French American Indians | 0.5 /100 | #237 | Tragic 13.9% |
| Ghanaians | 0.5 /100 | #238 | Tragic 13.9% |
| Nicaraguans | 0.4 /100 | #239 | Tragic 13.9% |
| Immigrants | Middle Africa | 0.4 /100 | #240 | Tragic 14.0% |
| Salvadorans | 0.4 /100 | #241 | Tragic 14.0% |
| Ecuadorians | 0.4 /100 | #242 | Tragic 14.0% |
| Sudanese | 0.3 /100 | #243 | Tragic 14.0% |
| Nepalese | 0.3 /100 | #244 | Tragic 14.0% |
| Immigrants | Sudan | 0.3 /100 | #245 | Tragic 14.1% |
| Potawatomi | 0.3 /100 | #246 | Tragic 14.1% |
| Liberians | 0.2 /100 | #247 | Tragic 14.1% |
Demographics Similar to Pueblo by Poverty
In terms of poverty, the demographic groups most similar to Pueblo are Sioux (19.8%, a difference of 1.9%), Cheyenne (18.9%, a difference of 2.5%), Yuman (20.2%, a difference of 4.1%), Houma (18.4%, a difference of 5.4%), and Apache (18.4%, a difference of 5.4%).
| Demographics | Rating | Rank | Poverty |
| Blacks/African Americans | 0.0 /100 | #329 | Tragic 17.3% |
| Dominicans | 0.0 /100 | #330 | Tragic 17.6% |
| Immigrants | Dominican Republic | 0.0 /100 | #331 | Tragic 17.8% |
| Natives/Alaskans | 0.0 /100 | #332 | Tragic 18.1% |
| Houma | 0.0 /100 | #333 | Tragic 18.4% |
| Apache | 0.0 /100 | #334 | Tragic 18.4% |
| Cheyenne | 0.0 /100 | #335 | Tragic 18.9% |
| Pueblo | 0.0 /100 | #336 | Tragic 19.4% |
| Sioux | 0.0 /100 | #337 | Tragic 19.8% |
| Yuman | 0.0 /100 | #338 | Tragic 20.2% |
| Crow | 0.0 /100 | #339 | Tragic 20.7% |
| Yup'ik | 0.0 /100 | #340 | Tragic 20.8% |
| Hopi | 0.0 /100 | #341 | Tragic 20.8% |
| Immigrants | Yemen | 0.0 /100 | #342 | Tragic 21.5% |
| Pima | 0.0 /100 | #343 | Tragic 21.9% |