Immigrants from Liberia vs Immigrants from South Central Asia Unemployment
COMPARE
Immigrants from Liberia
Immigrants from South Central Asia
Unemployment
Unemployment Comparison
Immigrants from Liberia
Immigrants from South Central Asia
5.8%
UNEMPLOYMENT
0.1/ 100
METRIC RATING
264th/ 347
METRIC RANK
4.9%
UNEMPLOYMENT
99.3/ 100
METRIC RATING
49th/ 347
METRIC RANK
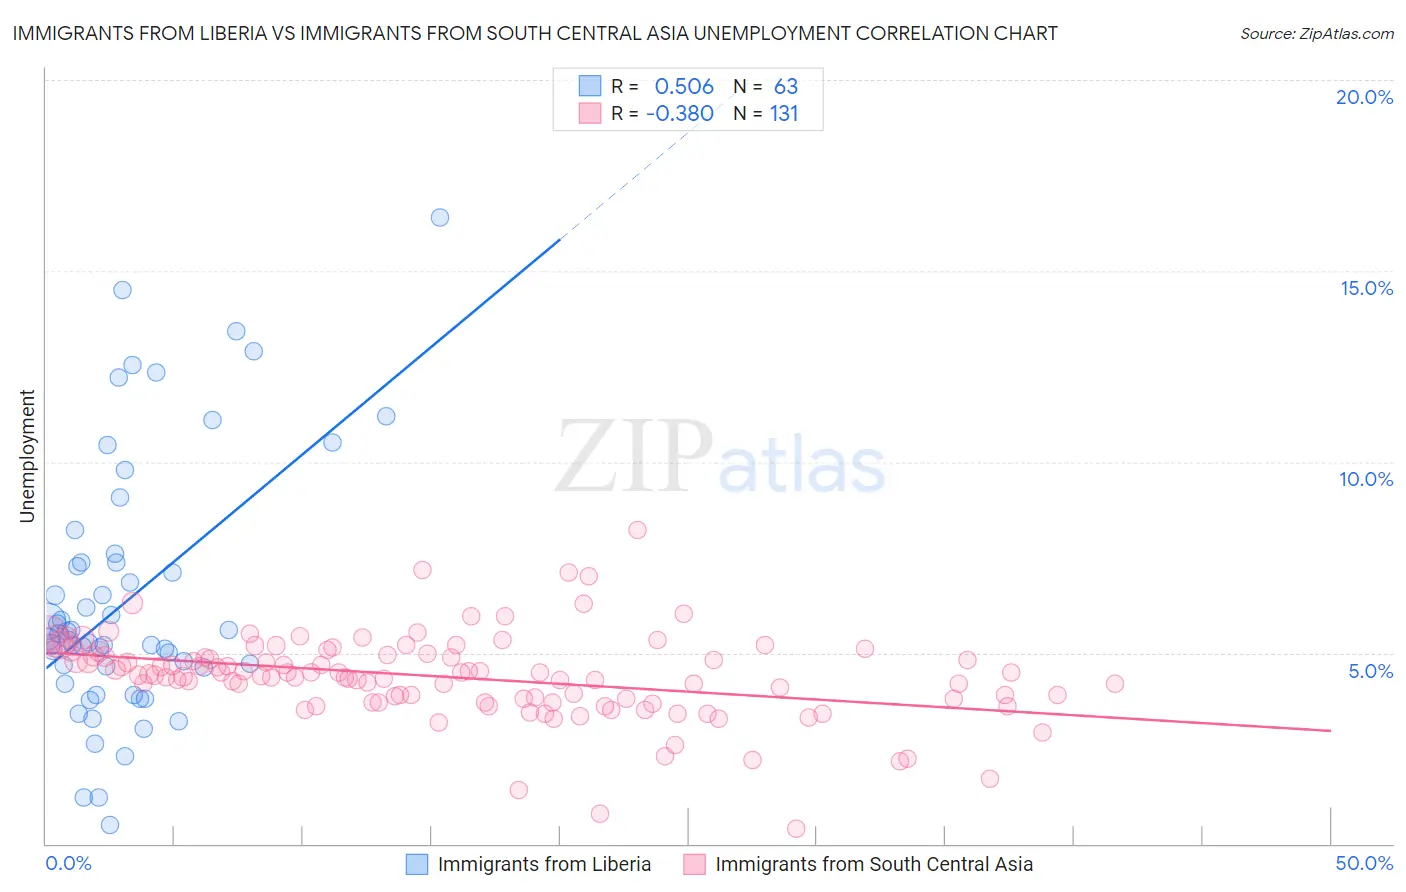
Immigrants from Liberia vs Immigrants from South Central Asia Unemployment Correlation Chart
The statistical analysis conducted on geographies consisting of 135,254,533 people shows a substantial positive correlation between the proportion of Immigrants from Liberia and unemployment in the United States with a correlation coefficient (R) of 0.506 and weighted average of 5.8%. Similarly, the statistical analysis conducted on geographies consisting of 472,428,090 people shows a mild negative correlation between the proportion of Immigrants from South Central Asia and unemployment in the United States with a correlation coefficient (R) of -0.380 and weighted average of 4.9%, a difference of 19.6%.
Unemployment Correlation Summary
| Measurement | Immigrants from Liberia | Immigrants from South Central Asia |
| Minimum | 0.50% | 0.40% |
| Maximum | 16.4% | 8.2% |
| Range | 15.9% | 7.8% |
| Mean | 6.4% | 4.4% |
| Median | 5.4% | 4.4% |
| Interquartile 25% (IQ1) | 4.6% | 3.8% |
| Interquartile 75% (IQ3) | 7.4% | 4.9% |
| Interquartile Range (IQR) | 2.8% | 1.2% |
| Standard Deviation (Sample) | 3.4% | 1.1% |
| Standard Deviation (Population) | 3.3% | 1.1% |
Similar Demographics by Unemployment
Demographics Similar to Immigrants from Liberia by Unemployment
In terms of unemployment, the demographic groups most similar to Immigrants from Liberia are Nigerian (5.8%, a difference of 0.070%), Salvadoran (5.8%, a difference of 0.090%), Sierra Leonean (5.8%, a difference of 0.13%), Immigrants from Guatemala (5.8%, a difference of 0.23%), and Immigrants from Uzbekistan (5.8%, a difference of 0.25%).
| Demographics | Rating | Rank | Unemployment |
| Yaqui | 0.2 /100 | #257 | Tragic 5.8% |
| Immigrants | Bahamas | 0.1 /100 | #258 | Tragic 5.8% |
| Sub-Saharan Africans | 0.1 /100 | #259 | Tragic 5.8% |
| Immigrants | Uzbekistan | 0.1 /100 | #260 | Tragic 5.8% |
| Immigrants | Guatemala | 0.1 /100 | #261 | Tragic 5.8% |
| Sierra Leoneans | 0.1 /100 | #262 | Tragic 5.8% |
| Salvadorans | 0.1 /100 | #263 | Tragic 5.8% |
| Immigrants | Liberia | 0.1 /100 | #264 | Tragic 5.8% |
| Nigerians | 0.1 /100 | #265 | Tragic 5.8% |
| Mexican American Indians | 0.1 /100 | #266 | Tragic 5.8% |
| Immigrants | Nigeria | 0.1 /100 | #267 | Tragic 5.8% |
| Immigrants | Sierra Leone | 0.1 /100 | #268 | Tragic 5.8% |
| Immigrants | El Salvador | 0.1 /100 | #269 | Tragic 5.8% |
| Blackfeet | 0.1 /100 | #270 | Tragic 5.8% |
| Mexicans | 0.1 /100 | #271 | Tragic 5.9% |
Demographics Similar to Immigrants from South Central Asia by Unemployment
In terms of unemployment, the demographic groups most similar to Immigrants from South Central Asia are Immigrants from Scotland (4.9%, a difference of 0.010%), French Canadian (4.9%, a difference of 0.020%), Immigrants from Belgium (4.9%, a difference of 0.18%), White/Caucasian (4.9%, a difference of 0.19%), and Immigrants from Taiwan (4.8%, a difference of 0.22%).
| Demographics | Rating | Rank | Unemployment |
| Filipinos | 99.5 /100 | #42 | Exceptional 4.8% |
| Yugoslavians | 99.5 /100 | #43 | Exceptional 4.8% |
| Austrians | 99.5 /100 | #44 | Exceptional 4.8% |
| French | 99.5 /100 | #45 | Exceptional 4.8% |
| Immigrants | Nepal | 99.4 /100 | #46 | Exceptional 4.8% |
| Immigrants | Taiwan | 99.4 /100 | #47 | Exceptional 4.8% |
| Immigrants | Scotland | 99.3 /100 | #48 | Exceptional 4.9% |
| Immigrants | South Central Asia | 99.3 /100 | #49 | Exceptional 4.9% |
| French Canadians | 99.3 /100 | #50 | Exceptional 4.9% |
| Immigrants | Belgium | 99.2 /100 | #51 | Exceptional 4.9% |
| Whites/Caucasians | 99.2 /100 | #52 | Exceptional 4.9% |
| Immigrants | Zimbabwe | 99.2 /100 | #53 | Exceptional 4.9% |
| Eastern Europeans | 99.2 /100 | #54 | Exceptional 4.9% |
| Australians | 99.2 /100 | #55 | Exceptional 4.9% |
| Celtics | 99.1 /100 | #56 | Exceptional 4.9% |