Immigrants from Liberia vs Immigrants from Brazil Poverty
COMPARE
Immigrants from Liberia
Immigrants from Brazil
Poverty
Poverty Comparison
Immigrants from Liberia
Immigrants from Brazil
14.4%
POVERTY
0.1/ 100
METRIC RATING
262nd/ 347
METRIC RANK
11.7%
POVERTY
88.2/ 100
METRIC RATING
125th/ 347
METRIC RANK
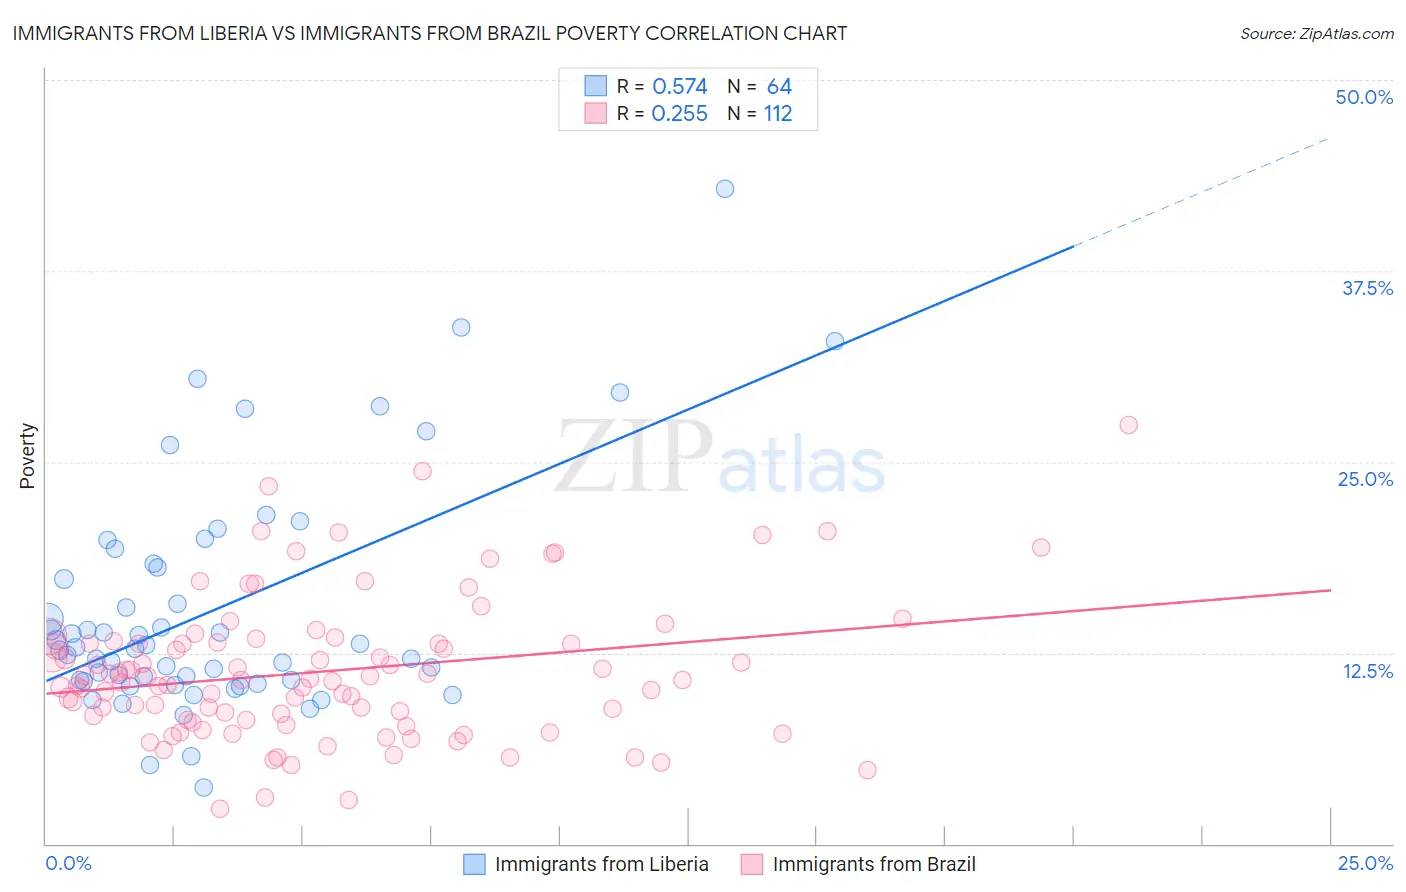
Immigrants from Liberia vs Immigrants from Brazil Poverty Correlation Chart
The statistical analysis conducted on geographies consisting of 135,251,059 people shows a substantial positive correlation between the proportion of Immigrants from Liberia and poverty level in the United States with a correlation coefficient (R) of 0.574 and weighted average of 14.4%. Similarly, the statistical analysis conducted on geographies consisting of 342,843,961 people shows a weak positive correlation between the proportion of Immigrants from Brazil and poverty level in the United States with a correlation coefficient (R) of 0.255 and weighted average of 11.7%, a difference of 22.7%.
Poverty Correlation Summary
| Measurement | Immigrants from Liberia | Immigrants from Brazil |
| Minimum | 3.7% | 2.3% |
| Maximum | 42.9% | 27.4% |
| Range | 39.2% | 25.1% |
| Mean | 15.3% | 11.3% |
| Median | 12.8% | 10.7% |
| Interquartile 25% (IQ1) | 10.7% | 8.1% |
| Interquartile 75% (IQ3) | 18.2% | 13.2% |
| Interquartile Range (IQR) | 7.5% | 5.1% |
| Standard Deviation (Sample) | 7.6% | 4.6% |
| Standard Deviation (Population) | 7.5% | 4.6% |
Similar Demographics by Poverty
Demographics Similar to Immigrants from Liberia by Poverty
In terms of poverty, the demographic groups most similar to Immigrants from Liberia are Cherokee (14.4%, a difference of 0.16%), Cape Verdean (14.4%, a difference of 0.18%), Immigrants from Nicaragua (14.3%, a difference of 0.26%), Jamaican (14.4%, a difference of 0.35%), and Immigrants from Jamaica (14.4%, a difference of 0.43%).
| Demographics | Rating | Rank | Poverty |
| Immigrants | Ecuador | 0.1 /100 | #255 | Tragic 14.3% |
| Mexican American Indians | 0.1 /100 | #256 | Tragic 14.3% |
| Trinidadians and Tobagonians | 0.1 /100 | #257 | Tragic 14.3% |
| Ottawa | 0.1 /100 | #258 | Tragic 14.3% |
| Immigrants | Nicaragua | 0.1 /100 | #259 | Tragic 14.3% |
| Cape Verdeans | 0.1 /100 | #260 | Tragic 14.4% |
| Cherokee | 0.1 /100 | #261 | Tragic 14.4% |
| Immigrants | Liberia | 0.1 /100 | #262 | Tragic 14.4% |
| Jamaicans | 0.1 /100 | #263 | Tragic 14.4% |
| Immigrants | Jamaica | 0.1 /100 | #264 | Tragic 14.4% |
| Immigrants | Guyana | 0.1 /100 | #265 | Tragic 14.5% |
| Guyanese | 0.1 /100 | #266 | Tragic 14.5% |
| Iroquois | 0.1 /100 | #267 | Tragic 14.5% |
| Sub-Saharan Africans | 0.1 /100 | #268 | Tragic 14.5% |
| Immigrants | Cuba | 0.1 /100 | #269 | Tragic 14.6% |
Demographics Similar to Immigrants from Brazil by Poverty
In terms of poverty, the demographic groups most similar to Immigrants from Brazil are Soviet Union (11.7%, a difference of 0.040%), Immigrants from Norway (11.7%, a difference of 0.040%), Immigrants from Argentina (11.7%, a difference of 0.060%), Immigrants from Hungary (11.7%, a difference of 0.11%), and New Zealander (11.7%, a difference of 0.13%).
| Demographics | Rating | Rank | Poverty |
| Argentineans | 89.1 /100 | #118 | Excellent 11.7% |
| Tlingit-Haida | 89.0 /100 | #119 | Excellent 11.7% |
| Immigrants | South Eastern Asia | 88.9 /100 | #120 | Excellent 11.7% |
| New Zealanders | 88.7 /100 | #121 | Excellent 11.7% |
| Puget Sound Salish | 88.7 /100 | #122 | Excellent 11.7% |
| Immigrants | Hungary | 88.6 /100 | #123 | Excellent 11.7% |
| Soviet Union | 88.4 /100 | #124 | Excellent 11.7% |
| Immigrants | Brazil | 88.2 /100 | #125 | Excellent 11.7% |
| Immigrants | Norway | 88.0 /100 | #126 | Excellent 11.7% |
| Immigrants | Argentina | 88.0 /100 | #127 | Excellent 11.7% |
| Immigrants | Israel | 87.4 /100 | #128 | Excellent 11.7% |
| South Africans | 87.0 /100 | #129 | Excellent 11.7% |
| Immigrants | Ukraine | 86.6 /100 | #130 | Excellent 11.8% |
| French | 86.1 /100 | #131 | Excellent 11.8% |
| Peruvians | 85.6 /100 | #132 | Excellent 11.8% |