Immigrants from Liberia vs French American Indian Poverty
COMPARE
Immigrants from Liberia
French American Indian
Poverty
Poverty Comparison
Immigrants from Liberia
French American Indians
14.4%
POVERTY
0.1/ 100
METRIC RATING
262nd/ 347
METRIC RANK
13.9%
POVERTY
0.5/ 100
METRIC RATING
237th/ 347
METRIC RANK
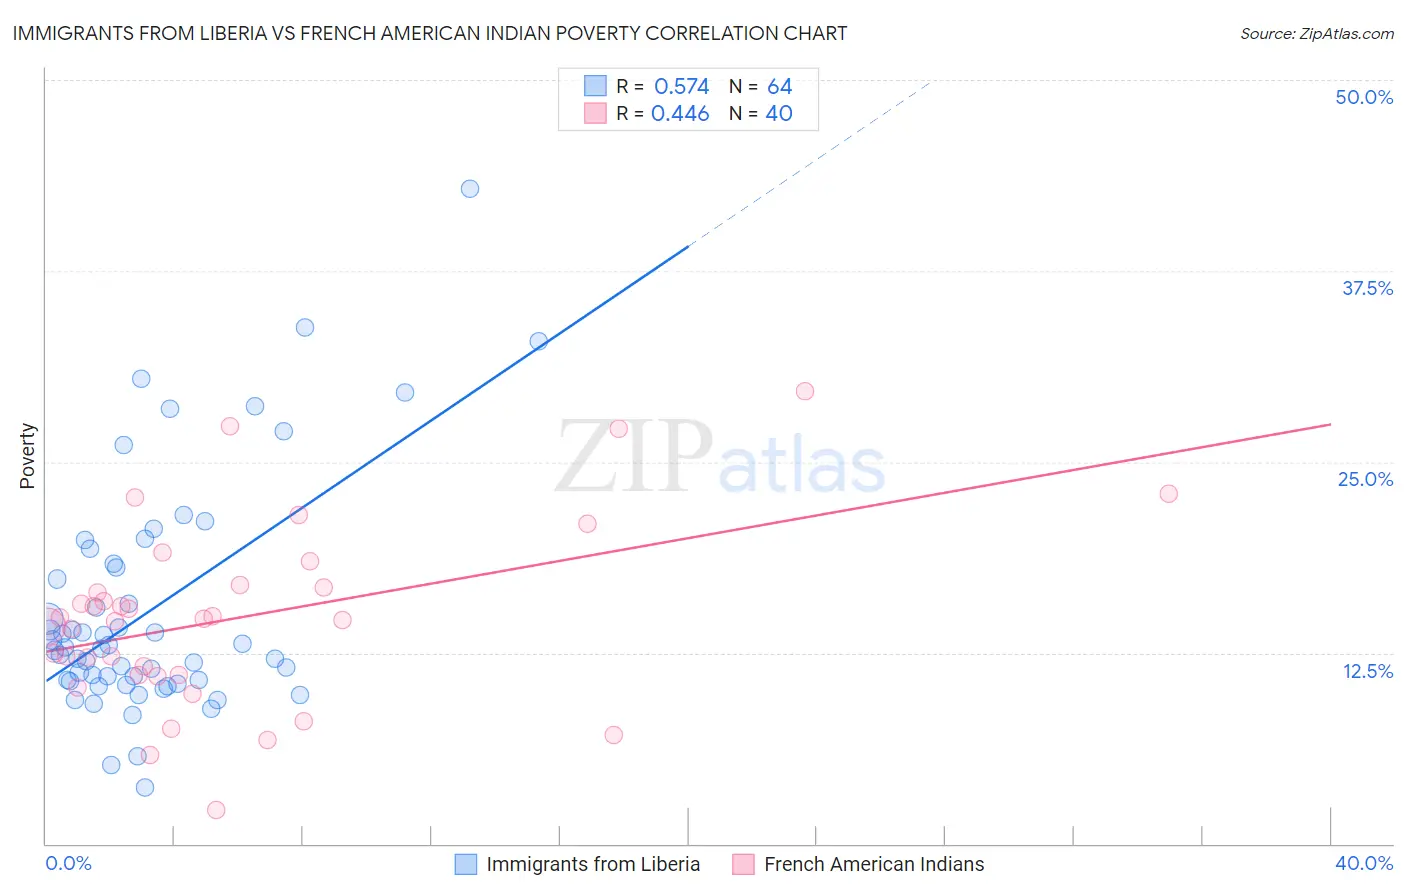
Immigrants from Liberia vs French American Indian Poverty Correlation Chart
The statistical analysis conducted on geographies consisting of 135,251,059 people shows a substantial positive correlation between the proportion of Immigrants from Liberia and poverty level in the United States with a correlation coefficient (R) of 0.574 and weighted average of 14.4%. Similarly, the statistical analysis conducted on geographies consisting of 131,970,723 people shows a moderate positive correlation between the proportion of French American Indians and poverty level in the United States with a correlation coefficient (R) of 0.446 and weighted average of 13.9%, a difference of 3.6%.
Poverty Correlation Summary
| Measurement | Immigrants from Liberia | French American Indian |
| Minimum | 3.7% | 2.2% |
| Maximum | 42.9% | 29.6% |
| Range | 39.2% | 27.4% |
| Mean | 15.3% | 14.8% |
| Median | 12.8% | 14.7% |
| Interquartile 25% (IQ1) | 10.7% | 11.0% |
| Interquartile 75% (IQ3) | 18.2% | 16.8% |
| Interquartile Range (IQR) | 7.5% | 5.8% |
| Standard Deviation (Sample) | 7.6% | 5.9% |
| Standard Deviation (Population) | 7.5% | 5.9% |
Similar Demographics by Poverty
Demographics Similar to Immigrants from Liberia by Poverty
In terms of poverty, the demographic groups most similar to Immigrants from Liberia are Cherokee (14.4%, a difference of 0.16%), Cape Verdean (14.4%, a difference of 0.18%), Immigrants from Nicaragua (14.3%, a difference of 0.26%), Jamaican (14.4%, a difference of 0.35%), and Immigrants from Jamaica (14.4%, a difference of 0.43%).
| Demographics | Rating | Rank | Poverty |
| Immigrants | Ecuador | 0.1 /100 | #255 | Tragic 14.3% |
| Mexican American Indians | 0.1 /100 | #256 | Tragic 14.3% |
| Trinidadians and Tobagonians | 0.1 /100 | #257 | Tragic 14.3% |
| Ottawa | 0.1 /100 | #258 | Tragic 14.3% |
| Immigrants | Nicaragua | 0.1 /100 | #259 | Tragic 14.3% |
| Cape Verdeans | 0.1 /100 | #260 | Tragic 14.4% |
| Cherokee | 0.1 /100 | #261 | Tragic 14.4% |
| Immigrants | Liberia | 0.1 /100 | #262 | Tragic 14.4% |
| Jamaicans | 0.1 /100 | #263 | Tragic 14.4% |
| Immigrants | Jamaica | 0.1 /100 | #264 | Tragic 14.4% |
| Immigrants | Guyana | 0.1 /100 | #265 | Tragic 14.5% |
| Guyanese | 0.1 /100 | #266 | Tragic 14.5% |
| Iroquois | 0.1 /100 | #267 | Tragic 14.5% |
| Sub-Saharan Africans | 0.1 /100 | #268 | Tragic 14.5% |
| Immigrants | Cuba | 0.1 /100 | #269 | Tragic 14.6% |
Demographics Similar to French American Indians by Poverty
In terms of poverty, the demographic groups most similar to French American Indians are Immigrants from Armenia (13.9%, a difference of 0.020%), Cuban (13.9%, a difference of 0.060%), Ghanaian (13.9%, a difference of 0.13%), Nicaraguan (13.9%, a difference of 0.48%), and Immigrants from Laos (13.8%, a difference of 0.49%).
| Demographics | Rating | Rank | Poverty |
| Alaskan Athabascans | 1.5 /100 | #230 | Tragic 13.6% |
| Nigerians | 1.4 /100 | #231 | Tragic 13.6% |
| Fijians | 0.8 /100 | #232 | Tragic 13.7% |
| Immigrants | Saudi Arabia | 0.8 /100 | #233 | Tragic 13.8% |
| Immigrants | Laos | 0.7 /100 | #234 | Tragic 13.8% |
| Cubans | 0.6 /100 | #235 | Tragic 13.9% |
| Immigrants | Armenia | 0.5 /100 | #236 | Tragic 13.9% |
| French American Indians | 0.5 /100 | #237 | Tragic 13.9% |
| Ghanaians | 0.5 /100 | #238 | Tragic 13.9% |
| Nicaraguans | 0.4 /100 | #239 | Tragic 13.9% |
| Immigrants | Middle Africa | 0.4 /100 | #240 | Tragic 14.0% |
| Salvadorans | 0.4 /100 | #241 | Tragic 14.0% |
| Ecuadorians | 0.4 /100 | #242 | Tragic 14.0% |
| Sudanese | 0.3 /100 | #243 | Tragic 14.0% |
| Nepalese | 0.3 /100 | #244 | Tragic 14.0% |