Immigrants from Liberia vs Dominican Poverty
COMPARE
Immigrants from Liberia
Dominican
Poverty
Poverty Comparison
Immigrants from Liberia
Dominicans
14.4%
POVERTY
0.1/ 100
METRIC RATING
262nd/ 347
METRIC RANK
17.6%
POVERTY
0.0/ 100
METRIC RATING
330th/ 347
METRIC RANK
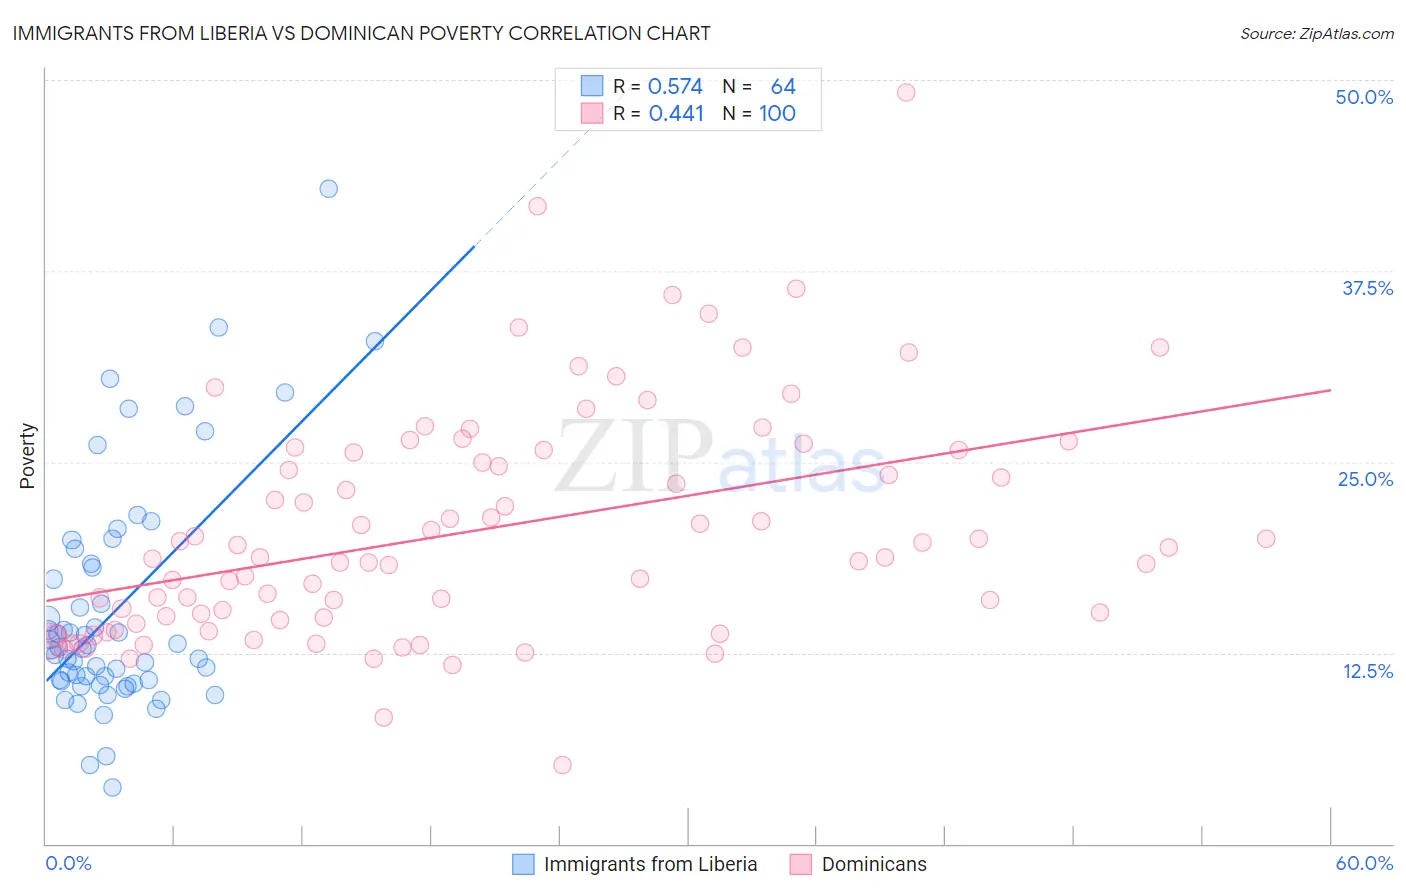
Immigrants from Liberia vs Dominican Poverty Correlation Chart
The statistical analysis conducted on geographies consisting of 135,251,059 people shows a substantial positive correlation between the proportion of Immigrants from Liberia and poverty level in the United States with a correlation coefficient (R) of 0.574 and weighted average of 14.4%. Similarly, the statistical analysis conducted on geographies consisting of 354,775,564 people shows a moderate positive correlation between the proportion of Dominicans and poverty level in the United States with a correlation coefficient (R) of 0.441 and weighted average of 17.6%, a difference of 22.7%.
Poverty Correlation Summary
| Measurement | Immigrants from Liberia | Dominican |
| Minimum | 3.7% | 5.1% |
| Maximum | 42.9% | 49.2% |
| Range | 39.2% | 44.1% |
| Mean | 15.3% | 20.5% |
| Median | 12.8% | 18.7% |
| Interquartile 25% (IQ1) | 10.7% | 14.7% |
| Interquartile 75% (IQ3) | 18.2% | 25.7% |
| Interquartile Range (IQR) | 7.5% | 11.0% |
| Standard Deviation (Sample) | 7.6% | 7.5% |
| Standard Deviation (Population) | 7.5% | 7.5% |
Similar Demographics by Poverty
Demographics Similar to Immigrants from Liberia by Poverty
In terms of poverty, the demographic groups most similar to Immigrants from Liberia are Cherokee (14.4%, a difference of 0.16%), Cape Verdean (14.4%, a difference of 0.18%), Immigrants from Nicaragua (14.3%, a difference of 0.26%), Jamaican (14.4%, a difference of 0.35%), and Immigrants from Jamaica (14.4%, a difference of 0.43%).
| Demographics | Rating | Rank | Poverty |
| Immigrants | Ecuador | 0.1 /100 | #255 | Tragic 14.3% |
| Mexican American Indians | 0.1 /100 | #256 | Tragic 14.3% |
| Trinidadians and Tobagonians | 0.1 /100 | #257 | Tragic 14.3% |
| Ottawa | 0.1 /100 | #258 | Tragic 14.3% |
| Immigrants | Nicaragua | 0.1 /100 | #259 | Tragic 14.3% |
| Cape Verdeans | 0.1 /100 | #260 | Tragic 14.4% |
| Cherokee | 0.1 /100 | #261 | Tragic 14.4% |
| Immigrants | Liberia | 0.1 /100 | #262 | Tragic 14.4% |
| Jamaicans | 0.1 /100 | #263 | Tragic 14.4% |
| Immigrants | Jamaica | 0.1 /100 | #264 | Tragic 14.4% |
| Immigrants | Guyana | 0.1 /100 | #265 | Tragic 14.5% |
| Guyanese | 0.1 /100 | #266 | Tragic 14.5% |
| Iroquois | 0.1 /100 | #267 | Tragic 14.5% |
| Sub-Saharan Africans | 0.1 /100 | #268 | Tragic 14.5% |
| Immigrants | Cuba | 0.1 /100 | #269 | Tragic 14.6% |
Demographics Similar to Dominicans by Poverty
In terms of poverty, the demographic groups most similar to Dominicans are Immigrants from Dominican Republic (17.8%, a difference of 0.92%), Black/African American (17.3%, a difference of 2.3%), Native/Alaskan (18.1%, a difference of 2.4%), Ute (16.9%, a difference of 4.3%), and Houma (18.4%, a difference of 4.4%).
| Demographics | Rating | Rank | Poverty |
| Colville | 0.0 /100 | #323 | Tragic 16.6% |
| Yakama | 0.0 /100 | #324 | Tragic 16.7% |
| Central American Indians | 0.0 /100 | #325 | Tragic 16.7% |
| Paiute | 0.0 /100 | #326 | Tragic 16.7% |
| Kiowa | 0.0 /100 | #327 | Tragic 16.8% |
| Ute | 0.0 /100 | #328 | Tragic 16.9% |
| Blacks/African Americans | 0.0 /100 | #329 | Tragic 17.3% |
| Dominicans | 0.0 /100 | #330 | Tragic 17.6% |
| Immigrants | Dominican Republic | 0.0 /100 | #331 | Tragic 17.8% |
| Natives/Alaskans | 0.0 /100 | #332 | Tragic 18.1% |
| Houma | 0.0 /100 | #333 | Tragic 18.4% |
| Apache | 0.0 /100 | #334 | Tragic 18.4% |
| Cheyenne | 0.0 /100 | #335 | Tragic 18.9% |
| Pueblo | 0.0 /100 | #336 | Tragic 19.4% |
| Sioux | 0.0 /100 | #337 | Tragic 19.8% |