Immigrants from Liberia vs Afghan Female Poverty
COMPARE
Immigrants from Liberia
Afghan
Female Poverty
Female Poverty Comparison
Immigrants from Liberia
Afghans
15.7%
FEMALE POVERTY
0.1/ 100
METRIC RATING
265th/ 347
METRIC RANK
13.0%
FEMALE POVERTY
79.8/ 100
METRIC RATING
144th/ 347
METRIC RANK
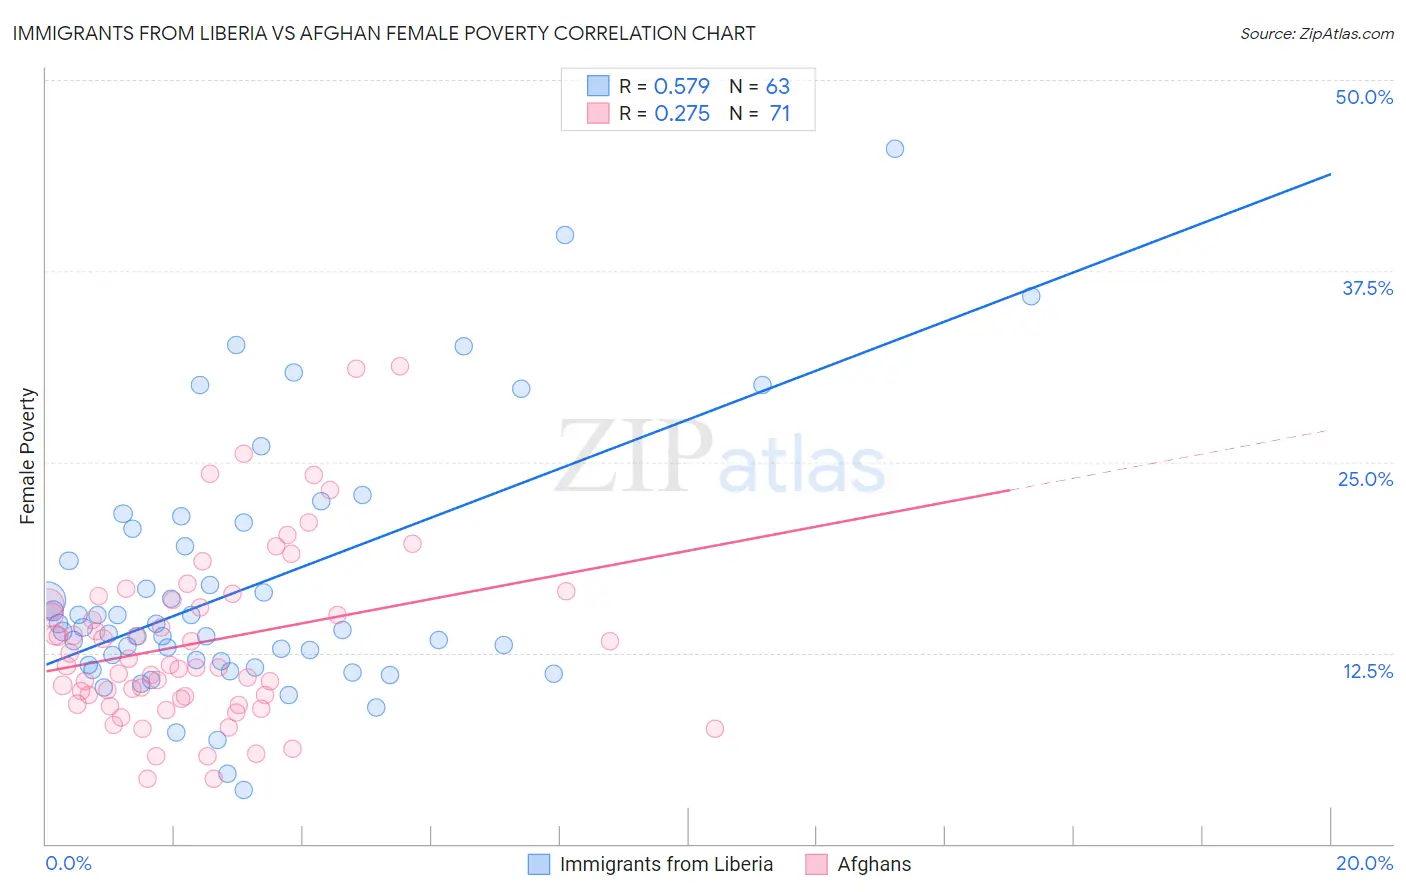
Immigrants from Liberia vs Afghan Female Poverty Correlation Chart
The statistical analysis conducted on geographies consisting of 135,246,592 people shows a substantial positive correlation between the proportion of Immigrants from Liberia and poverty level among females in the United States with a correlation coefficient (R) of 0.579 and weighted average of 15.7%. Similarly, the statistical analysis conducted on geographies consisting of 148,814,784 people shows a weak positive correlation between the proportion of Afghans and poverty level among females in the United States with a correlation coefficient (R) of 0.275 and weighted average of 13.0%, a difference of 20.6%.
Female Poverty Correlation Summary
| Measurement | Immigrants from Liberia | Afghan |
| Minimum | 3.5% | 4.3% |
| Maximum | 45.5% | 31.3% |
| Range | 42.0% | 27.0% |
| Mean | 16.9% | 13.2% |
| Median | 14.0% | 11.6% |
| Interquartile 25% (IQ1) | 11.7% | 9.5% |
| Interquartile 75% (IQ3) | 20.6% | 16.0% |
| Interquartile Range (IQR) | 8.9% | 6.5% |
| Standard Deviation (Sample) | 8.4% | 5.7% |
| Standard Deviation (Population) | 8.3% | 5.6% |
Similar Demographics by Female Poverty
Demographics Similar to Immigrants from Liberia by Female Poverty
In terms of female poverty, the demographic groups most similar to Immigrants from Liberia are Immigrants from El Salvador (15.7%, a difference of 0.060%), Immigrants from Ecuador (15.6%, a difference of 0.30%), Cherokee (15.6%, a difference of 0.42%), Mexican American Indian (15.6%, a difference of 0.43%), and Guyanese (15.6%, a difference of 0.44%).
| Demographics | Rating | Rank | Female Poverty |
| Shoshone | 0.1 /100 | #258 | Tragic 15.6% |
| Cape Verdeans | 0.1 /100 | #259 | Tragic 15.6% |
| Immigrants | Guyana | 0.1 /100 | #260 | Tragic 15.6% |
| Guyanese | 0.1 /100 | #261 | Tragic 15.6% |
| Mexican American Indians | 0.1 /100 | #262 | Tragic 15.6% |
| Cherokee | 0.1 /100 | #263 | Tragic 15.6% |
| Immigrants | Ecuador | 0.1 /100 | #264 | Tragic 15.6% |
| Immigrants | Liberia | 0.1 /100 | #265 | Tragic 15.7% |
| Immigrants | El Salvador | 0.1 /100 | #266 | Tragic 15.7% |
| Sub-Saharan Africans | 0.1 /100 | #267 | Tragic 15.8% |
| Immigrants | Nicaragua | 0.1 /100 | #268 | Tragic 15.8% |
| Iroquois | 0.1 /100 | #269 | Tragic 15.8% |
| Chickasaw | 0.1 /100 | #270 | Tragic 15.9% |
| Immigrants | St. Vincent and the Grenadines | 0.0 /100 | #271 | Tragic 15.9% |
| Belizeans | 0.0 /100 | #272 | Tragic 15.9% |
Demographics Similar to Afghans by Female Poverty
In terms of female poverty, the demographic groups most similar to Afghans are Syrian (13.0%, a difference of 0.030%), Immigrants from Malaysia (13.0%, a difference of 0.090%), Brazilian (13.0%, a difference of 0.11%), Immigrants from Peru (13.0%, a difference of 0.11%), and Immigrants from Kazakhstan (13.0%, a difference of 0.18%).
| Demographics | Rating | Rank | Female Poverty |
| Chileans | 84.7 /100 | #137 | Excellent 12.9% |
| Immigrants | France | 83.6 /100 | #138 | Excellent 12.9% |
| Basques | 83.1 /100 | #139 | Excellent 12.9% |
| Pakistanis | 83.0 /100 | #140 | Excellent 12.9% |
| Icelanders | 81.1 /100 | #141 | Excellent 13.0% |
| Brazilians | 80.5 /100 | #142 | Excellent 13.0% |
| Immigrants | Malaysia | 80.4 /100 | #143 | Excellent 13.0% |
| Afghans | 79.8 /100 | #144 | Good 13.0% |
| Syrians | 79.6 /100 | #145 | Good 13.0% |
| Immigrants | Peru | 79.1 /100 | #146 | Good 13.0% |
| Immigrants | Kazakhstan | 78.6 /100 | #147 | Good 13.0% |
| Yugoslavians | 76.9 /100 | #148 | Good 13.1% |
| Taiwanese | 75.7 /100 | #149 | Good 13.1% |
| Tsimshian | 75.5 /100 | #150 | Good 13.1% |
| Immigrants | Germany | 74.9 /100 | #151 | Good 13.1% |