Immigrants from Liberia vs Immigrants from Jordan Female Poverty
COMPARE
Immigrants from Liberia
Immigrants from Jordan
Female Poverty
Female Poverty Comparison
Immigrants from Liberia
Immigrants from Jordan
15.7%
FEMALE POVERTY
0.1/ 100
METRIC RATING
265th/ 347
METRIC RANK
12.8%
FEMALE POVERTY
86.9/ 100
METRIC RATING
132nd/ 347
METRIC RANK
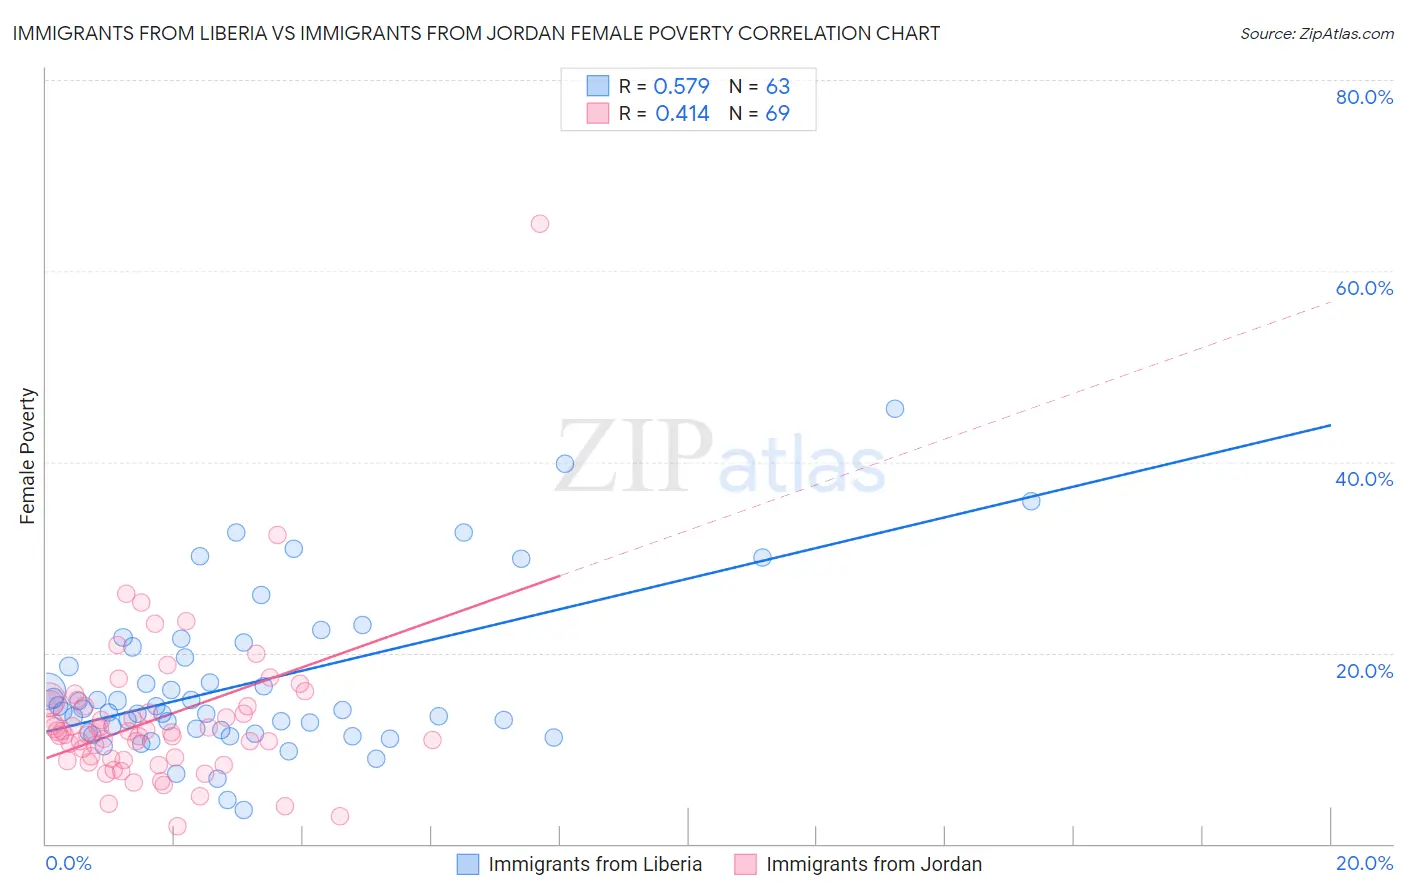
Immigrants from Liberia vs Immigrants from Jordan Female Poverty Correlation Chart
The statistical analysis conducted on geographies consisting of 135,246,592 people shows a substantial positive correlation between the proportion of Immigrants from Liberia and poverty level among females in the United States with a correlation coefficient (R) of 0.579 and weighted average of 15.7%. Similarly, the statistical analysis conducted on geographies consisting of 181,244,945 people shows a moderate positive correlation between the proportion of Immigrants from Jordan and poverty level among females in the United States with a correlation coefficient (R) of 0.414 and weighted average of 12.8%, a difference of 22.2%.
Female Poverty Correlation Summary
| Measurement | Immigrants from Liberia | Immigrants from Jordan |
| Minimum | 3.5% | 1.8% |
| Maximum | 45.5% | 64.9% |
| Range | 42.0% | 63.1% |
| Mean | 16.9% | 13.0% |
| Median | 14.0% | 11.7% |
| Interquartile 25% (IQ1) | 11.7% | 8.8% |
| Interquartile 75% (IQ3) | 20.6% | 14.5% |
| Interquartile Range (IQR) | 8.9% | 5.7% |
| Standard Deviation (Sample) | 8.4% | 8.4% |
| Standard Deviation (Population) | 8.3% | 8.3% |
Similar Demographics by Female Poverty
Demographics Similar to Immigrants from Liberia by Female Poverty
In terms of female poverty, the demographic groups most similar to Immigrants from Liberia are Immigrants from El Salvador (15.7%, a difference of 0.060%), Immigrants from Ecuador (15.6%, a difference of 0.30%), Cherokee (15.6%, a difference of 0.42%), Mexican American Indian (15.6%, a difference of 0.43%), and Guyanese (15.6%, a difference of 0.44%).
| Demographics | Rating | Rank | Female Poverty |
| Shoshone | 0.1 /100 | #258 | Tragic 15.6% |
| Cape Verdeans | 0.1 /100 | #259 | Tragic 15.6% |
| Immigrants | Guyana | 0.1 /100 | #260 | Tragic 15.6% |
| Guyanese | 0.1 /100 | #261 | Tragic 15.6% |
| Mexican American Indians | 0.1 /100 | #262 | Tragic 15.6% |
| Cherokee | 0.1 /100 | #263 | Tragic 15.6% |
| Immigrants | Ecuador | 0.1 /100 | #264 | Tragic 15.6% |
| Immigrants | Liberia | 0.1 /100 | #265 | Tragic 15.7% |
| Immigrants | El Salvador | 0.1 /100 | #266 | Tragic 15.7% |
| Sub-Saharan Africans | 0.1 /100 | #267 | Tragic 15.8% |
| Immigrants | Nicaragua | 0.1 /100 | #268 | Tragic 15.8% |
| Iroquois | 0.1 /100 | #269 | Tragic 15.8% |
| Chickasaw | 0.1 /100 | #270 | Tragic 15.9% |
| Immigrants | St. Vincent and the Grenadines | 0.0 /100 | #271 | Tragic 15.9% |
| Belizeans | 0.0 /100 | #272 | Tragic 15.9% |
Demographics Similar to Immigrants from Jordan by Female Poverty
In terms of female poverty, the demographic groups most similar to Immigrants from Jordan are Immigrants from Argentina (12.8%, a difference of 0.010%), Immigrants from Vietnam (12.8%, a difference of 0.050%), Immigrants from Western Europe (12.8%, a difference of 0.060%), Immigrants from Switzerland (12.9%, a difference of 0.22%), and Immigrants from Brazil (12.8%, a difference of 0.24%).
| Demographics | Rating | Rank | Female Poverty |
| Argentineans | 89.1 /100 | #125 | Excellent 12.8% |
| Immigrants | Ukraine | 88.8 /100 | #126 | Excellent 12.8% |
| South Africans | 88.4 /100 | #127 | Excellent 12.8% |
| Immigrants | Belarus | 88.2 /100 | #128 | Excellent 12.8% |
| Immigrants | Brazil | 87.9 /100 | #129 | Excellent 12.8% |
| Immigrants | Vietnam | 87.1 /100 | #130 | Excellent 12.8% |
| Immigrants | Argentina | 87.0 /100 | #131 | Excellent 12.8% |
| Immigrants | Jordan | 86.9 /100 | #132 | Excellent 12.8% |
| Immigrants | Western Europe | 86.6 /100 | #133 | Excellent 12.8% |
| Immigrants | Switzerland | 85.8 /100 | #134 | Excellent 12.9% |
| French | 85.6 /100 | #135 | Excellent 12.9% |
| Peruvians | 85.2 /100 | #136 | Excellent 12.9% |
| Chileans | 84.7 /100 | #137 | Excellent 12.9% |
| Immigrants | France | 83.6 /100 | #138 | Excellent 12.9% |
| Basques | 83.1 /100 | #139 | Excellent 12.9% |