Immigrants from Ireland vs Afghan Female Poverty
COMPARE
Immigrants from Ireland
Afghan
Female Poverty
Female Poverty Comparison
Immigrants from Ireland
Afghans
11.0%
FEMALE POVERTY
99.9/ 100
METRIC RATING
6th/ 347
METRIC RANK
13.0%
FEMALE POVERTY
79.8/ 100
METRIC RATING
144th/ 347
METRIC RANK
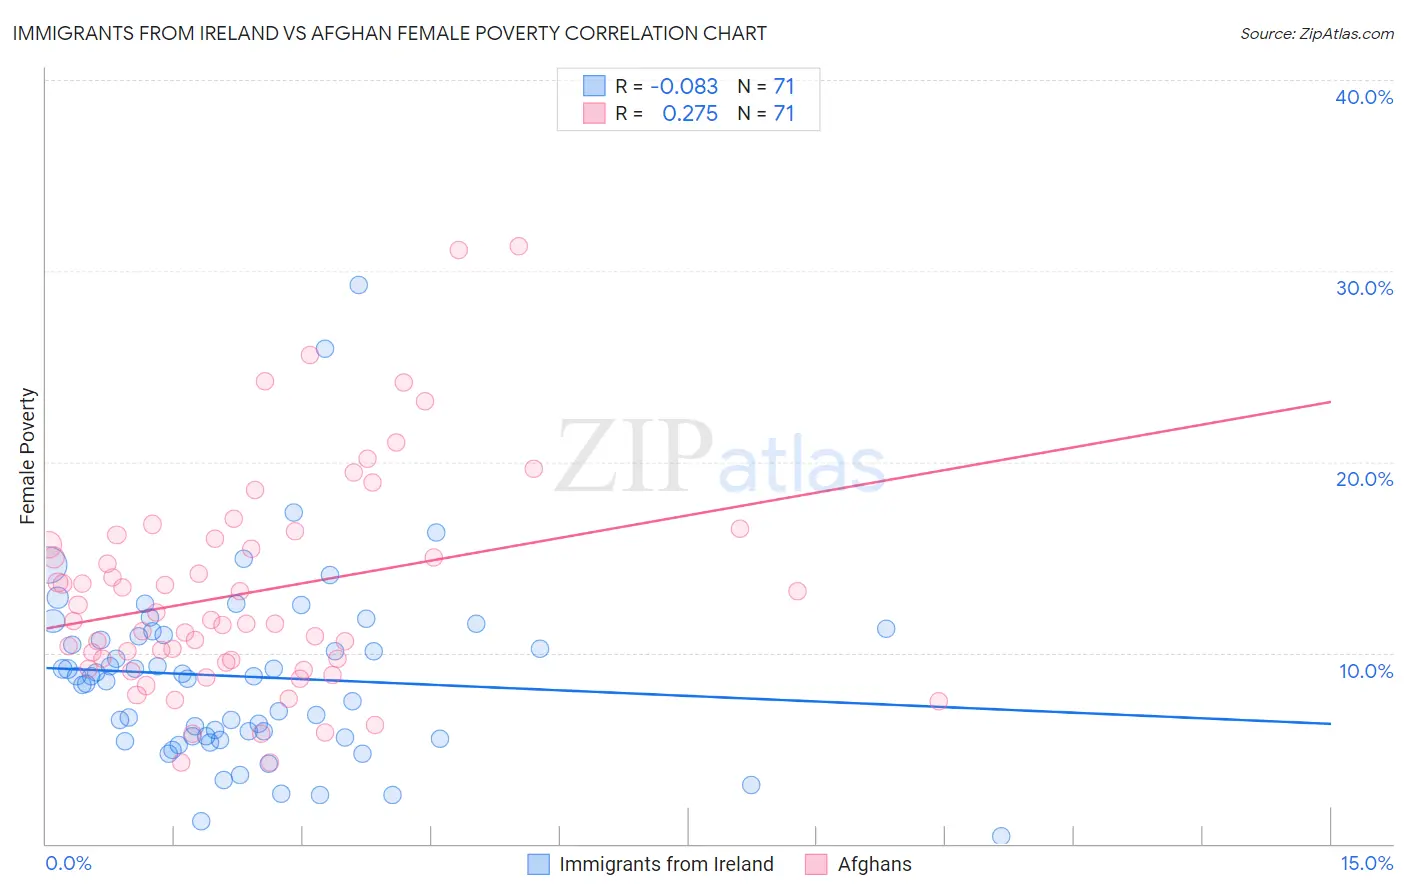
Immigrants from Ireland vs Afghan Female Poverty Correlation Chart
The statistical analysis conducted on geographies consisting of 240,733,190 people shows a slight negative correlation between the proportion of Immigrants from Ireland and poverty level among females in the United States with a correlation coefficient (R) of -0.083 and weighted average of 11.0%. Similarly, the statistical analysis conducted on geographies consisting of 148,814,784 people shows a weak positive correlation between the proportion of Afghans and poverty level among females in the United States with a correlation coefficient (R) of 0.275 and weighted average of 13.0%, a difference of 18.2%.
Female Poverty Correlation Summary
| Measurement | Immigrants from Ireland | Afghan |
| Minimum | 0.42% | 4.3% |
| Maximum | 29.3% | 31.3% |
| Range | 28.9% | 27.0% |
| Mean | 8.7% | 13.2% |
| Median | 8.8% | 11.6% |
| Interquartile 25% (IQ1) | 5.6% | 9.5% |
| Interquartile 75% (IQ3) | 10.9% | 16.0% |
| Interquartile Range (IQR) | 5.3% | 6.5% |
| Standard Deviation (Sample) | 4.8% | 5.7% |
| Standard Deviation (Population) | 4.8% | 5.6% |
Similar Demographics by Female Poverty
Demographics Similar to Immigrants from Ireland by Female Poverty
In terms of female poverty, the demographic groups most similar to Immigrants from Ireland are Assyrian/Chaldean/Syriac (11.0%, a difference of 0.37%), Filipino (10.9%, a difference of 0.38%), Immigrants from South Central Asia (11.1%, a difference of 1.1%), Bulgarian (11.1%, a difference of 1.3%), and Immigrants from Hong Kong (11.2%, a difference of 2.1%).
| Demographics | Rating | Rank | Female Poverty |
| Immigrants | India | 100.0 /100 | #1 | Exceptional 9.9% |
| Chinese | 100.0 /100 | #2 | Exceptional 10.4% |
| Thais | 100.0 /100 | #3 | Exceptional 10.5% |
| Immigrants | Taiwan | 100.0 /100 | #4 | Exceptional 10.5% |
| Filipinos | 100.0 /100 | #5 | Exceptional 10.9% |
| Immigrants | Ireland | 99.9 /100 | #6 | Exceptional 11.0% |
| Assyrians/Chaldeans/Syriacs | 99.9 /100 | #7 | Exceptional 11.0% |
| Immigrants | South Central Asia | 99.9 /100 | #8 | Exceptional 11.1% |
| Bulgarians | 99.9 /100 | #9 | Exceptional 11.1% |
| Immigrants | Hong Kong | 99.9 /100 | #10 | Exceptional 11.2% |
| Maltese | 99.9 /100 | #11 | Exceptional 11.2% |
| Bhutanese | 99.9 /100 | #12 | Exceptional 11.3% |
| Immigrants | Lithuania | 99.9 /100 | #13 | Exceptional 11.3% |
| Lithuanians | 99.8 /100 | #14 | Exceptional 11.4% |
| Latvians | 99.8 /100 | #15 | Exceptional 11.4% |
Demographics Similar to Afghans by Female Poverty
In terms of female poverty, the demographic groups most similar to Afghans are Syrian (13.0%, a difference of 0.030%), Immigrants from Malaysia (13.0%, a difference of 0.090%), Brazilian (13.0%, a difference of 0.11%), Immigrants from Peru (13.0%, a difference of 0.11%), and Immigrants from Kazakhstan (13.0%, a difference of 0.18%).
| Demographics | Rating | Rank | Female Poverty |
| Chileans | 84.7 /100 | #137 | Excellent 12.9% |
| Immigrants | France | 83.6 /100 | #138 | Excellent 12.9% |
| Basques | 83.1 /100 | #139 | Excellent 12.9% |
| Pakistanis | 83.0 /100 | #140 | Excellent 12.9% |
| Icelanders | 81.1 /100 | #141 | Excellent 13.0% |
| Brazilians | 80.5 /100 | #142 | Excellent 13.0% |
| Immigrants | Malaysia | 80.4 /100 | #143 | Excellent 13.0% |
| Afghans | 79.8 /100 | #144 | Good 13.0% |
| Syrians | 79.6 /100 | #145 | Good 13.0% |
| Immigrants | Peru | 79.1 /100 | #146 | Good 13.0% |
| Immigrants | Kazakhstan | 78.6 /100 | #147 | Good 13.0% |
| Yugoslavians | 76.9 /100 | #148 | Good 13.1% |
| Taiwanese | 75.7 /100 | #149 | Good 13.1% |
| Tsimshian | 75.5 /100 | #150 | Good 13.1% |
| Immigrants | Germany | 74.9 /100 | #151 | Good 13.1% |