Cajun vs Afghan Female Poverty
COMPARE
Cajun
Afghan
Female Poverty
Female Poverty Comparison
Cajuns
Afghans
17.5%
FEMALE POVERTY
0.0/ 100
METRIC RATING
319th/ 347
METRIC RANK
13.0%
FEMALE POVERTY
79.8/ 100
METRIC RATING
144th/ 347
METRIC RANK
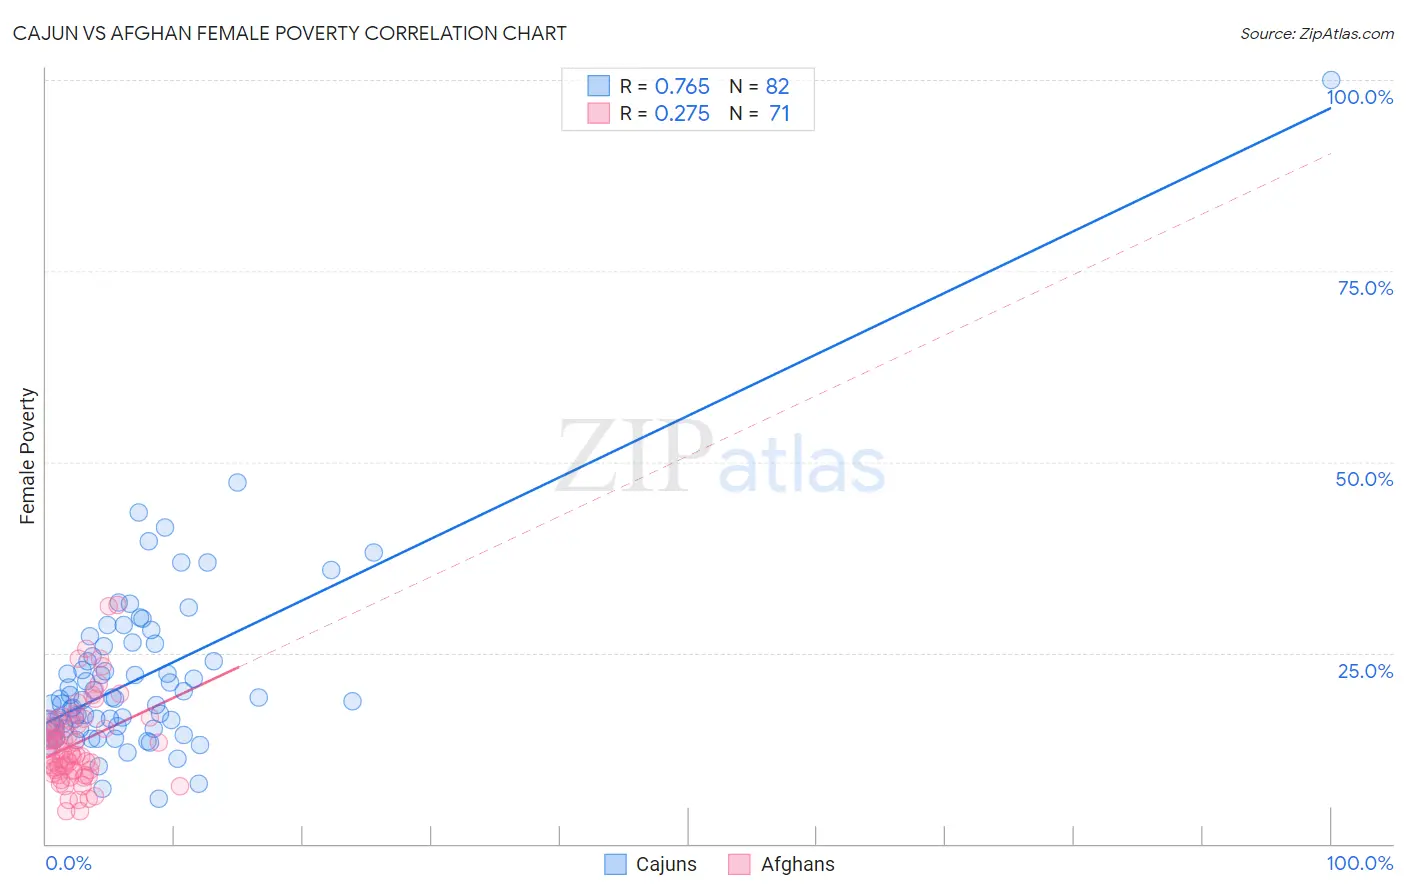
Cajun vs Afghan Female Poverty Correlation Chart
The statistical analysis conducted on geographies consisting of 149,687,613 people shows a strong positive correlation between the proportion of Cajuns and poverty level among females in the United States with a correlation coefficient (R) of 0.765 and weighted average of 17.5%. Similarly, the statistical analysis conducted on geographies consisting of 148,814,784 people shows a weak positive correlation between the proportion of Afghans and poverty level among females in the United States with a correlation coefficient (R) of 0.275 and weighted average of 13.0%, a difference of 34.3%.
Female Poverty Correlation Summary
| Measurement | Cajun | Afghan |
| Minimum | 5.9% | 4.3% |
| Maximum | 100.0% | 31.3% |
| Range | 94.1% | 27.0% |
| Mean | 21.9% | 13.2% |
| Median | 18.9% | 11.6% |
| Interquartile 25% (IQ1) | 15.1% | 9.5% |
| Interquartile 75% (IQ3) | 25.9% | 16.0% |
| Interquartile Range (IQR) | 10.8% | 6.5% |
| Standard Deviation (Sample) | 12.1% | 5.7% |
| Standard Deviation (Population) | 12.1% | 5.6% |
Similar Demographics by Female Poverty
Demographics Similar to Cajuns by Female Poverty
In terms of female poverty, the demographic groups most similar to Cajuns are Ute (17.5%, a difference of 0.010%), Immigrants from Dominica (17.5%, a difference of 0.080%), Arapaho (17.5%, a difference of 0.15%), Immigrants from Congo (17.4%, a difference of 0.34%), and Honduran (17.4%, a difference of 0.53%).
| Demographics | Rating | Rank | Female Poverty |
| Immigrants | Somalia | 0.0 /100 | #312 | Tragic 17.0% |
| British West Indians | 0.0 /100 | #313 | Tragic 17.0% |
| Dutch West Indians | 0.0 /100 | #314 | Tragic 17.1% |
| U.S. Virgin Islanders | 0.0 /100 | #315 | Tragic 17.3% |
| Hondurans | 0.0 /100 | #316 | Tragic 17.4% |
| Immigrants | Congo | 0.0 /100 | #317 | Tragic 17.4% |
| Ute | 0.0 /100 | #318 | Tragic 17.5% |
| Cajuns | 0.0 /100 | #319 | Tragic 17.5% |
| Immigrants | Dominica | 0.0 /100 | #320 | Tragic 17.5% |
| Arapaho | 0.0 /100 | #321 | Tragic 17.5% |
| Menominee | 0.0 /100 | #322 | Tragic 17.6% |
| Paiute | 0.0 /100 | #323 | Tragic 17.7% |
| Immigrants | Honduras | 0.0 /100 | #324 | Tragic 17.7% |
| Colville | 0.0 /100 | #325 | Tragic 17.8% |
| Central American Indians | 0.0 /100 | #326 | Tragic 18.0% |
Demographics Similar to Afghans by Female Poverty
In terms of female poverty, the demographic groups most similar to Afghans are Syrian (13.0%, a difference of 0.030%), Immigrants from Malaysia (13.0%, a difference of 0.090%), Brazilian (13.0%, a difference of 0.11%), Immigrants from Peru (13.0%, a difference of 0.11%), and Immigrants from Kazakhstan (13.0%, a difference of 0.18%).
| Demographics | Rating | Rank | Female Poverty |
| Chileans | 84.7 /100 | #137 | Excellent 12.9% |
| Immigrants | France | 83.6 /100 | #138 | Excellent 12.9% |
| Basques | 83.1 /100 | #139 | Excellent 12.9% |
| Pakistanis | 83.0 /100 | #140 | Excellent 12.9% |
| Icelanders | 81.1 /100 | #141 | Excellent 13.0% |
| Brazilians | 80.5 /100 | #142 | Excellent 13.0% |
| Immigrants | Malaysia | 80.4 /100 | #143 | Excellent 13.0% |
| Afghans | 79.8 /100 | #144 | Good 13.0% |
| Syrians | 79.6 /100 | #145 | Good 13.0% |
| Immigrants | Peru | 79.1 /100 | #146 | Good 13.0% |
| Immigrants | Kazakhstan | 78.6 /100 | #147 | Good 13.0% |
| Yugoslavians | 76.9 /100 | #148 | Good 13.1% |
| Taiwanese | 75.7 /100 | #149 | Good 13.1% |
| Tsimshian | 75.5 /100 | #150 | Good 13.1% |
| Immigrants | Germany | 74.9 /100 | #151 | Good 13.1% |