Immigrants from Latvia vs Kiowa Poverty
COMPARE
Immigrants from Latvia
Kiowa
Poverty
Poverty Comparison
Immigrants from Latvia
Kiowa
11.5%
POVERTY
94.5/ 100
METRIC RATING
98th/ 347
METRIC RANK
16.8%
POVERTY
0.0/ 100
METRIC RATING
327th/ 347
METRIC RANK
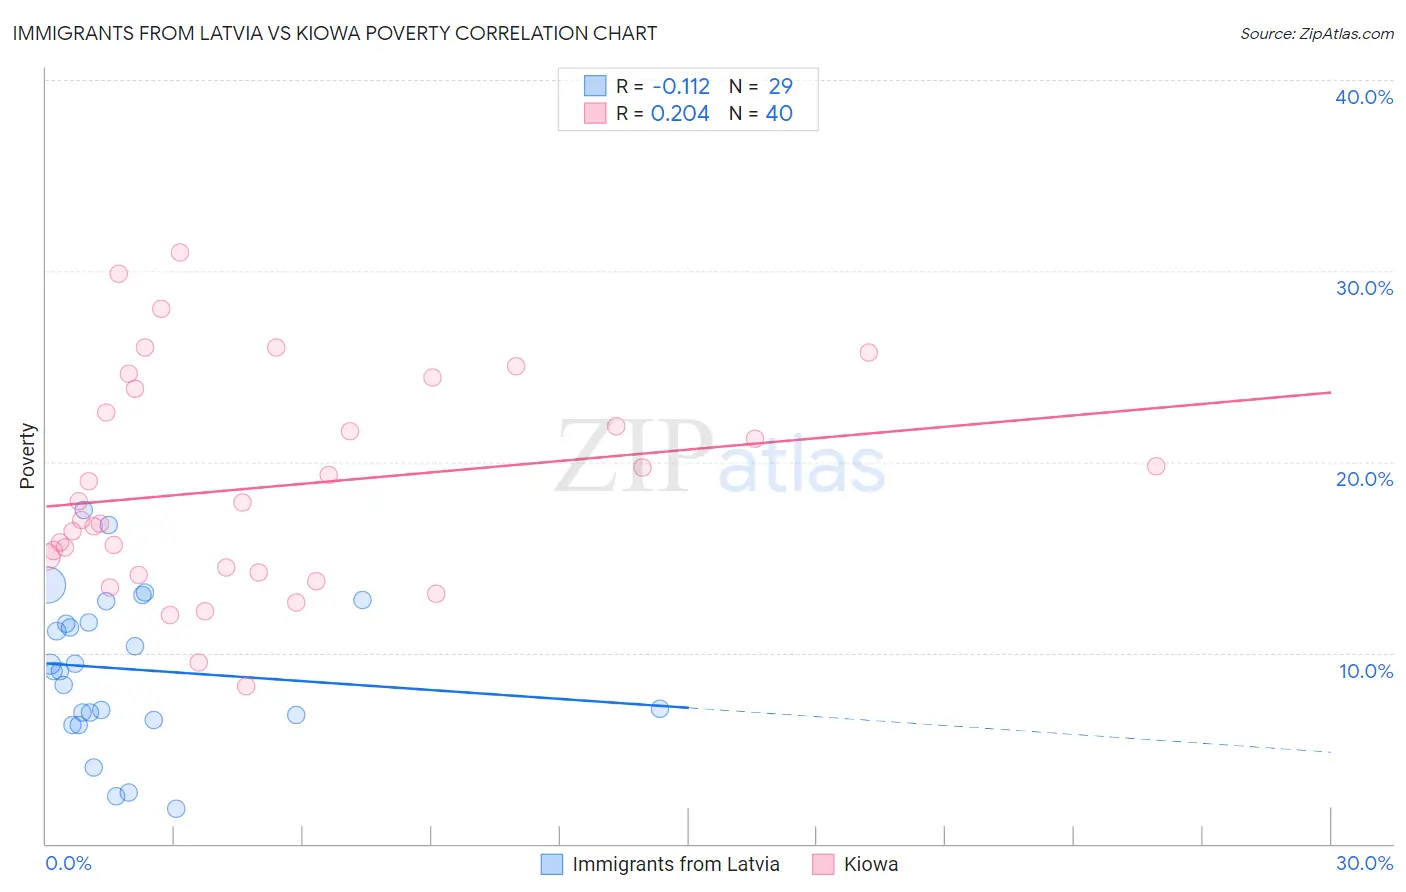
Immigrants from Latvia vs Kiowa Poverty Correlation Chart
The statistical analysis conducted on geographies consisting of 113,731,697 people shows a poor negative correlation between the proportion of Immigrants from Latvia and poverty level in the United States with a correlation coefficient (R) of -0.112 and weighted average of 11.5%. Similarly, the statistical analysis conducted on geographies consisting of 56,099,000 people shows a weak positive correlation between the proportion of Kiowa and poverty level in the United States with a correlation coefficient (R) of 0.204 and weighted average of 16.8%, a difference of 46.8%.
Poverty Correlation Summary
| Measurement | Immigrants from Latvia | Kiowa |
| Minimum | 1.8% | 8.3% |
| Maximum | 17.5% | 31.0% |
| Range | 15.6% | 22.7% |
| Mean | 9.1% | 18.7% |
| Median | 9.1% | 17.4% |
| Interquartile 25% (IQ1) | 6.6% | 14.3% |
| Interquartile 75% (IQ3) | 12.2% | 23.2% |
| Interquartile Range (IQR) | 5.6% | 8.9% |
| Standard Deviation (Sample) | 4.0% | 5.6% |
| Standard Deviation (Population) | 3.9% | 5.5% |
Similar Demographics by Poverty
Demographics Similar to Immigrants from Latvia by Poverty
In terms of poverty, the demographic groups most similar to Immigrants from Latvia are Immigrants from Egypt (11.5%, a difference of 0.030%), Immigrants from South Africa (11.5%, a difference of 0.070%), Immigrants from Indonesia (11.5%, a difference of 0.14%), Paraguayan (11.4%, a difference of 0.19%), and Australian (11.4%, a difference of 0.19%).
| Demographics | Rating | Rank | Poverty |
| Finns | 95.2 /100 | #91 | Exceptional 11.4% |
| British | 95.0 /100 | #92 | Exceptional 11.4% |
| Romanians | 94.9 /100 | #93 | Exceptional 11.4% |
| Paraguayans | 94.9 /100 | #94 | Exceptional 11.4% |
| Australians | 94.9 /100 | #95 | Exceptional 11.4% |
| Immigrants | South Africa | 94.7 /100 | #96 | Exceptional 11.5% |
| Immigrants | Egypt | 94.6 /100 | #97 | Exceptional 11.5% |
| Immigrants | Latvia | 94.5 /100 | #98 | Exceptional 11.5% |
| Immigrants | Indonesia | 94.2 /100 | #99 | Exceptional 11.5% |
| Scottish | 94.0 /100 | #100 | Exceptional 11.5% |
| Slavs | 93.3 /100 | #101 | Exceptional 11.5% |
| Laotians | 92.4 /100 | #102 | Exceptional 11.6% |
| Okinawans | 92.4 /100 | #103 | Exceptional 11.6% |
| Native Hawaiians | 92.1 /100 | #104 | Exceptional 11.6% |
| Portuguese | 92.1 /100 | #105 | Exceptional 11.6% |
Demographics Similar to Kiowa by Poverty
In terms of poverty, the demographic groups most similar to Kiowa are Ute (16.9%, a difference of 0.43%), Paiute (16.7%, a difference of 0.53%), Central American Indian (16.7%, a difference of 0.82%), Yakama (16.7%, a difference of 1.1%), and Colville (16.6%, a difference of 1.6%).
| Demographics | Rating | Rank | Poverty |
| Immigrants | Honduras | 0.0 /100 | #320 | Tragic 16.2% |
| Arapaho | 0.0 /100 | #321 | Tragic 16.3% |
| Menominee | 0.0 /100 | #322 | Tragic 16.4% |
| Colville | 0.0 /100 | #323 | Tragic 16.6% |
| Yakama | 0.0 /100 | #324 | Tragic 16.7% |
| Central American Indians | 0.0 /100 | #325 | Tragic 16.7% |
| Paiute | 0.0 /100 | #326 | Tragic 16.7% |
| Kiowa | 0.0 /100 | #327 | Tragic 16.8% |
| Ute | 0.0 /100 | #328 | Tragic 16.9% |
| Blacks/African Americans | 0.0 /100 | #329 | Tragic 17.3% |
| Dominicans | 0.0 /100 | #330 | Tragic 17.6% |
| Immigrants | Dominican Republic | 0.0 /100 | #331 | Tragic 17.8% |
| Natives/Alaskans | 0.0 /100 | #332 | Tragic 18.1% |
| Houma | 0.0 /100 | #333 | Tragic 18.4% |
| Apache | 0.0 /100 | #334 | Tragic 18.4% |