Immigrants from Kenya vs Taiwanese 7th Grade
COMPARE
Immigrants from Kenya
Taiwanese
7th Grade
7th Grade Comparison
Immigrants from Kenya
Taiwanese
96.1%
7TH GRADE
66.8/ 100
METRIC RATING
160th/ 347
METRIC RANK
94.8%
7TH GRADE
0.0/ 100
METRIC RATING
289th/ 347
METRIC RANK
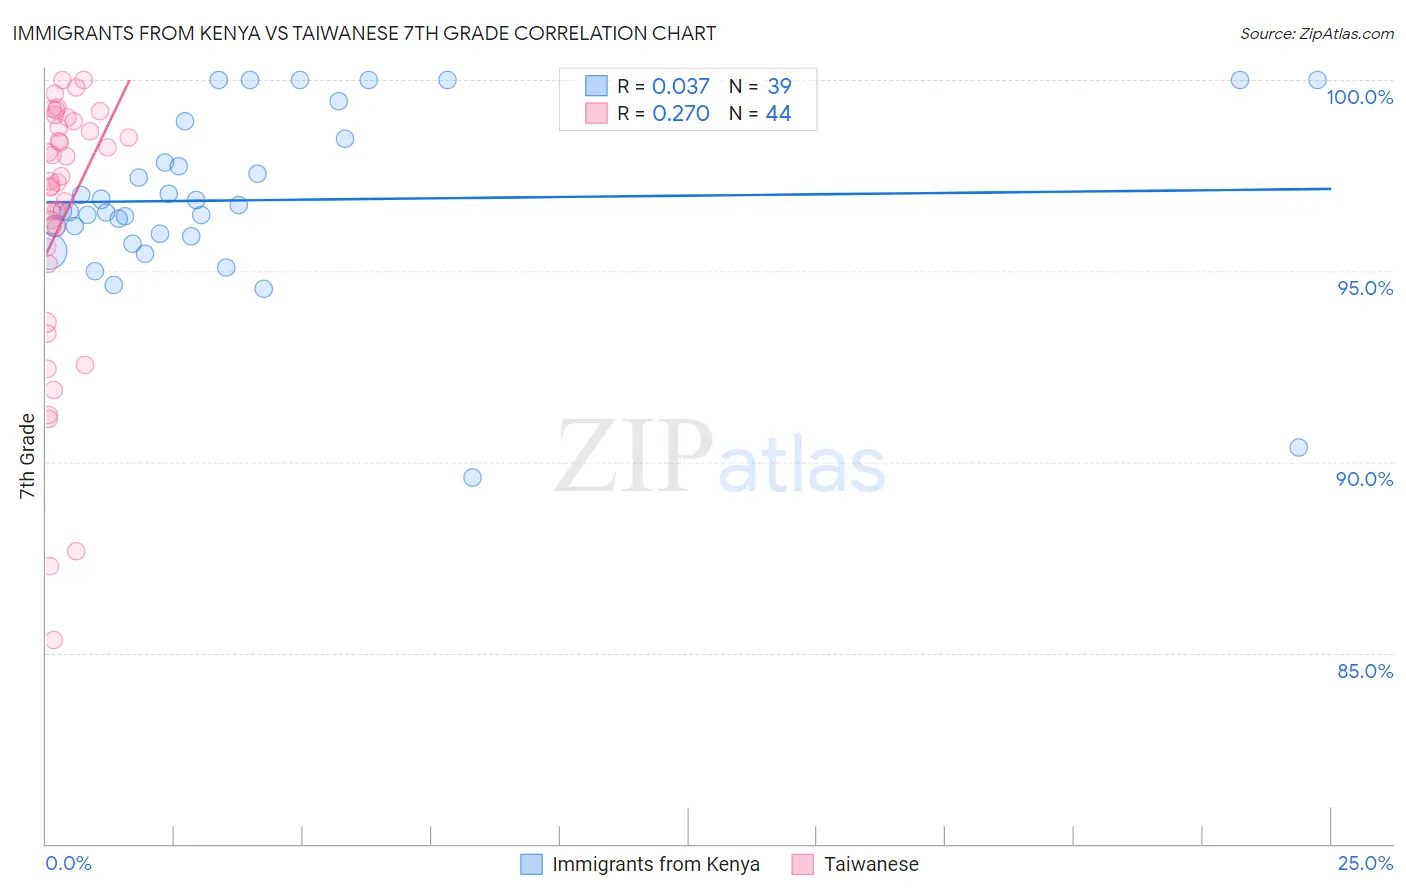
Immigrants from Kenya vs Taiwanese 7th Grade Correlation Chart
The statistical analysis conducted on geographies consisting of 218,076,690 people shows no correlation between the proportion of Immigrants from Kenya and percentage of population with at least 7th grade education in the United States with a correlation coefficient (R) of 0.037 and weighted average of 96.1%. Similarly, the statistical analysis conducted on geographies consisting of 31,724,936 people shows a weak positive correlation between the proportion of Taiwanese and percentage of population with at least 7th grade education in the United States with a correlation coefficient (R) of 0.270 and weighted average of 94.8%, a difference of 1.4%.
7th Grade Correlation Summary
| Measurement | Immigrants from Kenya | Taiwanese |
| Minimum | 89.6% | 85.3% |
| Maximum | 100.0% | 100.0% |
| Range | 10.4% | 14.7% |
| Mean | 96.9% | 96.3% |
| Median | 96.6% | 97.3% |
| Interquartile 25% (IQ1) | 95.9% | 95.4% |
| Interquartile 75% (IQ3) | 98.5% | 98.8% |
| Interquartile Range (IQR) | 2.6% | 3.4% |
| Standard Deviation (Sample) | 2.3% | 3.6% |
| Standard Deviation (Population) | 2.3% | 3.5% |
Similar Demographics by 7th Grade
Demographics Similar to Immigrants from Kenya by 7th Grade
In terms of 7th grade, the demographic groups most similar to Immigrants from Kenya are Alsatian (96.1%, a difference of 0.0%), Bermudan (96.1%, a difference of 0.0%), Arab (96.2%, a difference of 0.010%), Pima (96.1%, a difference of 0.020%), and Spaniard (96.1%, a difference of 0.030%).
| Demographics | Rating | Rank | 7th Grade |
| Seminole | 78.1 /100 | #153 | Good 96.2% |
| Immigrants | Israel | 77.6 /100 | #154 | Good 96.2% |
| Immigrants | Jordan | 77.0 /100 | #155 | Good 96.2% |
| Kenyans | 76.2 /100 | #156 | Good 96.2% |
| Ugandans | 75.5 /100 | #157 | Good 96.2% |
| Arabs | 68.6 /100 | #158 | Good 96.2% |
| Alsatians | 67.2 /100 | #159 | Good 96.1% |
| Immigrants | Kenya | 66.8 /100 | #160 | Good 96.1% |
| Bermudans | 66.3 /100 | #161 | Good 96.1% |
| Pima | 64.3 /100 | #162 | Good 96.1% |
| Spaniards | 62.6 /100 | #163 | Good 96.1% |
| Immigrants | Italy | 62.1 /100 | #164 | Good 96.1% |
| Immigrants | Taiwan | 61.5 /100 | #165 | Good 96.1% |
| Immigrants | Kazakhstan | 61.0 /100 | #166 | Good 96.1% |
| Immigrants | Sri Lanka | 59.9 /100 | #167 | Average 96.1% |
Demographics Similar to Taiwanese by 7th Grade
In terms of 7th grade, the demographic groups most similar to Taiwanese are British West Indian (94.8%, a difference of 0.010%), Malaysian (94.8%, a difference of 0.020%), Immigrants from Peru (94.9%, a difference of 0.030%), Immigrants from Philippines (94.9%, a difference of 0.040%), and Immigrants from Grenada (94.8%, a difference of 0.060%).
| Demographics | Rating | Rank | 7th Grade |
| Immigrants | Bolivia | 0.1 /100 | #282 | Tragic 95.0% |
| Immigrants | Barbados | 0.1 /100 | #283 | Tragic 95.0% |
| Armenians | 0.1 /100 | #284 | Tragic 95.0% |
| Immigrants | Eritrea | 0.1 /100 | #285 | Tragic 94.9% |
| Immigrants | Philippines | 0.0 /100 | #286 | Tragic 94.9% |
| Immigrants | Peru | 0.0 /100 | #287 | Tragic 94.9% |
| British West Indians | 0.0 /100 | #288 | Tragic 94.8% |
| Taiwanese | 0.0 /100 | #289 | Tragic 94.8% |
| Malaysians | 0.0 /100 | #290 | Tragic 94.8% |
| Immigrants | Grenada | 0.0 /100 | #291 | Tragic 94.8% |
| Immigrants | West Indies | 0.0 /100 | #292 | Tragic 94.8% |
| Fijians | 0.0 /100 | #293 | Tragic 94.7% |
| Haitians | 0.0 /100 | #294 | Tragic 94.7% |
| Yaqui | 0.0 /100 | #295 | Tragic 94.6% |
| Cubans | 0.0 /100 | #296 | Tragic 94.6% |