Immigrants from Kenya vs Taiwanese Doctorate Degree
COMPARE
Immigrants from Kenya
Taiwanese
Doctorate Degree
Doctorate Degree Comparison
Immigrants from Kenya
Taiwanese
1.9%
DOCTORATE DEGREE
74.3/ 100
METRIC RATING
152nd/ 347
METRIC RANK
2.1%
DOCTORATE DEGREE
96.7/ 100
METRIC RATING
115th/ 347
METRIC RANK
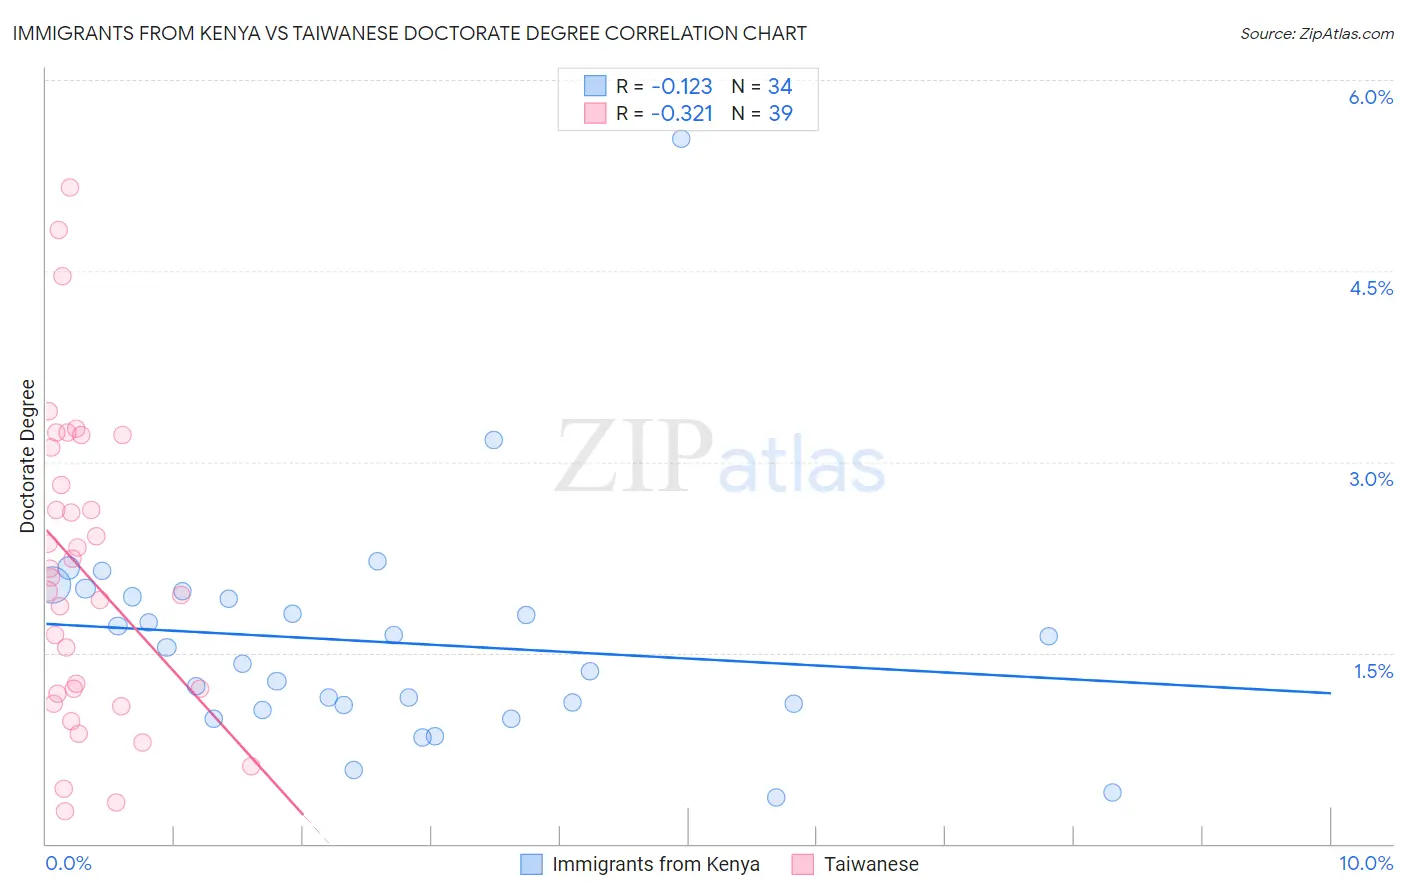
Immigrants from Kenya vs Taiwanese Doctorate Degree Correlation Chart
The statistical analysis conducted on geographies consisting of 217,428,476 people shows a poor negative correlation between the proportion of Immigrants from Kenya and percentage of population with at least doctorate degree education in the United States with a correlation coefficient (R) of -0.123 and weighted average of 1.9%. Similarly, the statistical analysis conducted on geographies consisting of 31,440,416 people shows a mild negative correlation between the proportion of Taiwanese and percentage of population with at least doctorate degree education in the United States with a correlation coefficient (R) of -0.321 and weighted average of 2.1%, a difference of 8.2%.
Doctorate Degree Correlation Summary
| Measurement | Immigrants from Kenya | Taiwanese |
| Minimum | 0.36% | 0.25% |
| Maximum | 5.5% | 5.2% |
| Range | 5.2% | 4.9% |
| Mean | 1.6% | 2.1% |
| Median | 1.5% | 2.1% |
| Interquartile 25% (IQ1) | 1.1% | 1.2% |
| Interquartile 75% (IQ3) | 1.9% | 3.1% |
| Interquartile Range (IQR) | 0.85% | 1.9% |
| Standard Deviation (Sample) | 0.91% | 1.2% |
| Standard Deviation (Population) | 0.90% | 1.2% |
Similar Demographics by Doctorate Degree
Demographics Similar to Immigrants from Kenya by Doctorate Degree
In terms of doctorate degree, the demographic groups most similar to Immigrants from Kenya are Immigrants from Oceania (1.9%, a difference of 0.050%), Albanian (1.9%, a difference of 0.10%), Immigrants from Albania (1.9%, a difference of 0.27%), Polish (1.9%, a difference of 0.29%), and English (1.9%, a difference of 0.30%).
| Demographics | Rating | Rank | Doctorate Degree |
| Kenyans | 83.6 /100 | #145 | Excellent 1.9% |
| Immigrants | Syria | 83.6 /100 | #146 | Excellent 1.9% |
| Immigrants | Senegal | 82.5 /100 | #147 | Excellent 1.9% |
| Luxembourgers | 81.1 /100 | #148 | Excellent 1.9% |
| Basques | 76.9 /100 | #149 | Good 1.9% |
| English | 75.9 /100 | #150 | Good 1.9% |
| Albanians | 74.8 /100 | #151 | Good 1.9% |
| Immigrants | Kenya | 74.3 /100 | #152 | Good 1.9% |
| Immigrants | Oceania | 74.0 /100 | #153 | Good 1.9% |
| Immigrants | Albania | 72.8 /100 | #154 | Good 1.9% |
| Poles | 72.7 /100 | #155 | Good 1.9% |
| Slavs | 72.4 /100 | #156 | Good 1.9% |
| Danes | 71.9 /100 | #157 | Good 1.9% |
| Hungarians | 71.7 /100 | #158 | Good 1.9% |
| Slovenes | 70.2 /100 | #159 | Good 1.9% |
Demographics Similar to Taiwanese by Doctorate Degree
In terms of doctorate degree, the demographic groups most similar to Taiwanese are Immigrants from Croatia (2.1%, a difference of 0.080%), Immigrants from Italy (2.1%, a difference of 0.23%), Syrian (2.1%, a difference of 0.44%), Immigrants from Pakistan (2.1%, a difference of 0.46%), and Maltese (2.1%, a difference of 0.46%).
| Demographics | Rating | Rank | Doctorate Degree |
| Immigrants | Germany | 97.3 /100 | #108 | Exceptional 2.1% |
| Ukrainians | 97.2 /100 | #109 | Exceptional 2.1% |
| Brazilians | 97.2 /100 | #110 | Exceptional 2.1% |
| Immigrants | Pakistan | 97.1 /100 | #111 | Exceptional 2.1% |
| Syrians | 97.1 /100 | #112 | Exceptional 2.1% |
| Immigrants | Italy | 96.9 /100 | #113 | Exceptional 2.1% |
| Immigrants | Croatia | 96.8 /100 | #114 | Exceptional 2.1% |
| Taiwanese | 96.7 /100 | #115 | Exceptional 2.1% |
| Maltese | 96.2 /100 | #116 | Exceptional 2.1% |
| Lebanese | 96.0 /100 | #117 | Exceptional 2.1% |
| Icelanders | 96.0 /100 | #118 | Exceptional 2.1% |
| Pakistanis | 95.8 /100 | #119 | Exceptional 2.0% |
| Immigrants | Morocco | 95.5 /100 | #120 | Exceptional 2.0% |
| Immigrants | Jordan | 94.8 /100 | #121 | Exceptional 2.0% |
| Immigrants | Southern Europe | 94.7 /100 | #122 | Exceptional 2.0% |