Immigrants from Kenya vs Immigrants from Colombia Married-Couple Family Poverty
COMPARE
Immigrants from Kenya
Immigrants from Colombia
Married-Couple Family Poverty
Married-Couple Family Poverty Comparison
Immigrants from Kenya
Immigrants from Colombia
4.9%
MARRIED-COUPLE FAMILY POVERTY
90.2/ 100
METRIC RATING
133rd/ 347
METRIC RANK
5.7%
MARRIED-COUPLE FAMILY POVERTY
3.7/ 100
METRIC RATING
233rd/ 347
METRIC RANK
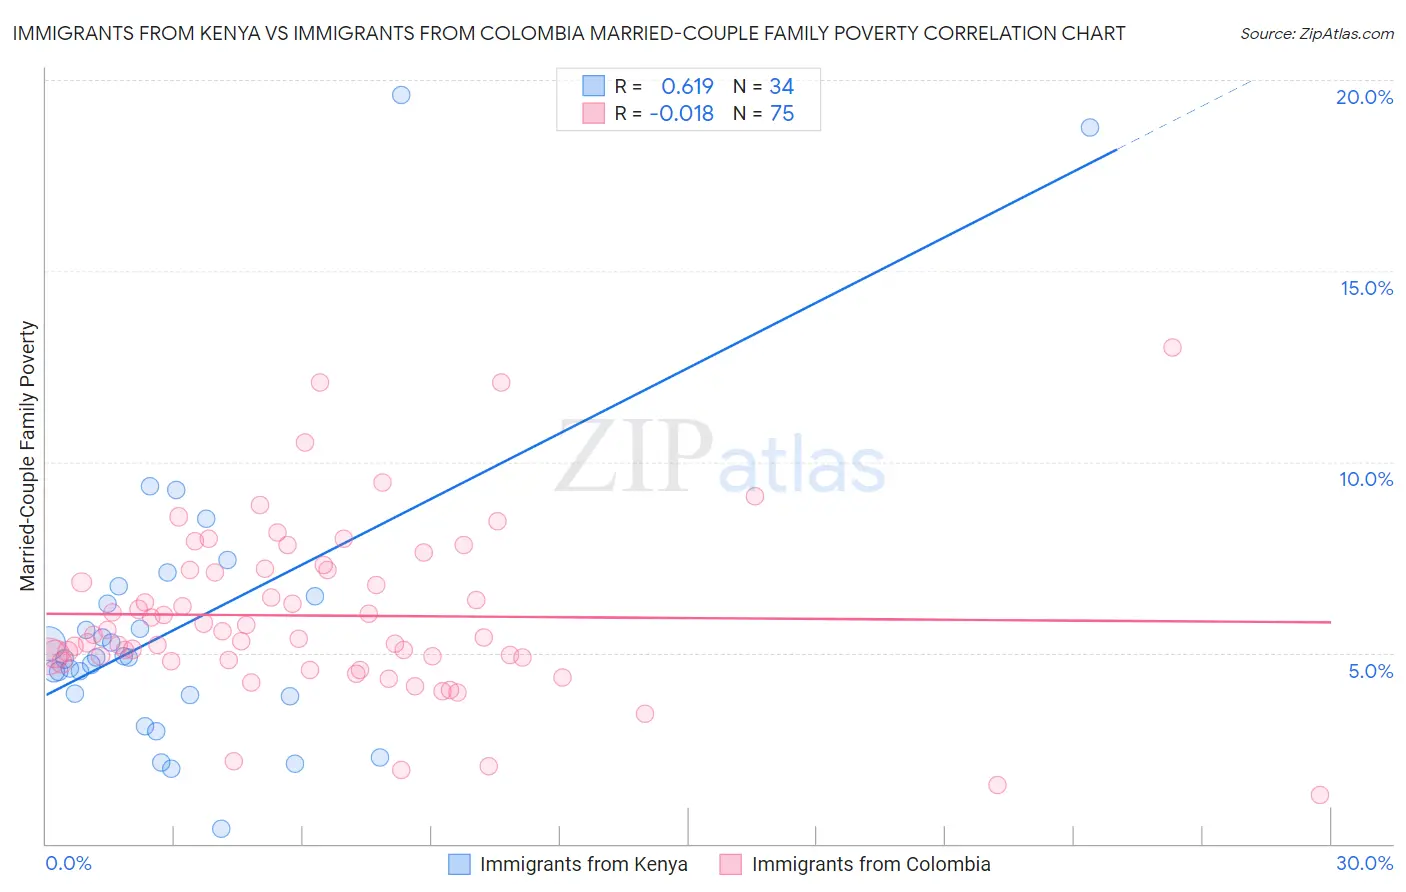
Immigrants from Kenya vs Immigrants from Colombia Married-Couple Family Poverty Correlation Chart
The statistical analysis conducted on geographies consisting of 217,162,212 people shows a significant positive correlation between the proportion of Immigrants from Kenya and poverty level among married-couple families in the United States with a correlation coefficient (R) of 0.619 and weighted average of 4.9%. Similarly, the statistical analysis conducted on geographies consisting of 375,670,549 people shows no correlation between the proportion of Immigrants from Colombia and poverty level among married-couple families in the United States with a correlation coefficient (R) of -0.018 and weighted average of 5.7%, a difference of 17.0%.
Married-Couple Family Poverty Correlation Summary
| Measurement | Immigrants from Kenya | Immigrants from Colombia |
| Minimum | 0.40% | 1.3% |
| Maximum | 19.6% | 13.0% |
| Range | 19.2% | 11.7% |
| Mean | 5.8% | 6.0% |
| Median | 4.9% | 5.5% |
| Interquartile 25% (IQ1) | 3.9% | 4.8% |
| Interquartile 75% (IQ3) | 6.5% | 7.2% |
| Interquartile Range (IQR) | 2.6% | 2.3% |
| Standard Deviation (Sample) | 4.0% | 2.2% |
| Standard Deviation (Population) | 3.9% | 2.2% |
Similar Demographics by Married-Couple Family Poverty
Demographics Similar to Immigrants from Kenya by Married-Couple Family Poverty
In terms of married-couple family poverty, the demographic groups most similar to Immigrants from Kenya are Samoan (4.9%, a difference of 0.010%), Puget Sound Salish (4.9%, a difference of 0.070%), Immigrants from Eastern Europe (4.9%, a difference of 0.090%), Soviet Union (4.9%, a difference of 0.15%), and Immigrants from Pakistan (4.9%, a difference of 0.16%).
| Demographics | Rating | Rank | Married-Couple Family Poverty |
| Immigrants | Asia | 92.3 /100 | #126 | Exceptional 4.8% |
| Egyptians | 92.0 /100 | #127 | Exceptional 4.8% |
| Palestinians | 91.2 /100 | #128 | Exceptional 4.9% |
| Immigrants | Pakistan | 90.7 /100 | #129 | Exceptional 4.9% |
| Soviet Union | 90.7 /100 | #130 | Exceptional 4.9% |
| Immigrants | Eastern Europe | 90.5 /100 | #131 | Exceptional 4.9% |
| Puget Sound Salish | 90.4 /100 | #132 | Exceptional 4.9% |
| Immigrants | Kenya | 90.2 /100 | #133 | Exceptional 4.9% |
| Samoans | 90.2 /100 | #134 | Exceptional 4.9% |
| Assyrians/Chaldeans/Syriacs | 89.4 /100 | #135 | Excellent 4.9% |
| Immigrants | Hungary | 88.7 /100 | #136 | Excellent 4.9% |
| Guamanians/Chamorros | 86.5 /100 | #137 | Excellent 4.9% |
| Chileans | 86.0 /100 | #138 | Excellent 4.9% |
| German Russians | 85.1 /100 | #139 | Excellent 5.0% |
| Immigrants | Portugal | 84.8 /100 | #140 | Excellent 5.0% |
Demographics Similar to Immigrants from Colombia by Married-Couple Family Poverty
In terms of married-couple family poverty, the demographic groups most similar to Immigrants from Colombia are Immigrants from Uruguay (5.7%, a difference of 0.010%), Immigrants from Sudan (5.7%, a difference of 0.19%), Ghanaian (5.7%, a difference of 0.35%), Immigrants from Laos (5.7%, a difference of 0.44%), and Immigrants from Iraq (5.7%, a difference of 0.49%).
| Demographics | Rating | Rank | Married-Couple Family Poverty |
| South Americans | 5.7 /100 | #226 | Tragic 5.6% |
| Immigrants | Zaire | 5.6 /100 | #227 | Tragic 5.6% |
| Arabs | 5.4 /100 | #228 | Tragic 5.7% |
| Sub-Saharan Africans | 4.9 /100 | #229 | Tragic 5.7% |
| Moroccans | 4.9 /100 | #230 | Tragic 5.7% |
| Immigrants | Iraq | 4.4 /100 | #231 | Tragic 5.7% |
| Immigrants | Laos | 4.4 /100 | #232 | Tragic 5.7% |
| Immigrants | Colombia | 3.7 /100 | #233 | Tragic 5.7% |
| Immigrants | Uruguay | 3.7 /100 | #234 | Tragic 5.7% |
| Immigrants | Sudan | 3.5 /100 | #235 | Tragic 5.7% |
| Ghanaians | 3.3 /100 | #236 | Tragic 5.7% |
| Immigrants | South America | 3.1 /100 | #237 | Tragic 5.7% |
| Cherokee | 2.7 /100 | #238 | Tragic 5.8% |
| Venezuelans | 2.7 /100 | #239 | Tragic 5.8% |
| Fijians | 2.5 /100 | #240 | Tragic 5.8% |