Egyptian vs South African Female Poverty
COMPARE
Egyptian
South African
Female Poverty
Female Poverty Comparison
Egyptians
South Africans
12.3%
FEMALE POVERTY
97.2/ 100
METRIC RATING
78th/ 347
METRIC RANK
12.8%
FEMALE POVERTY
88.4/ 100
METRIC RATING
127th/ 347
METRIC RANK
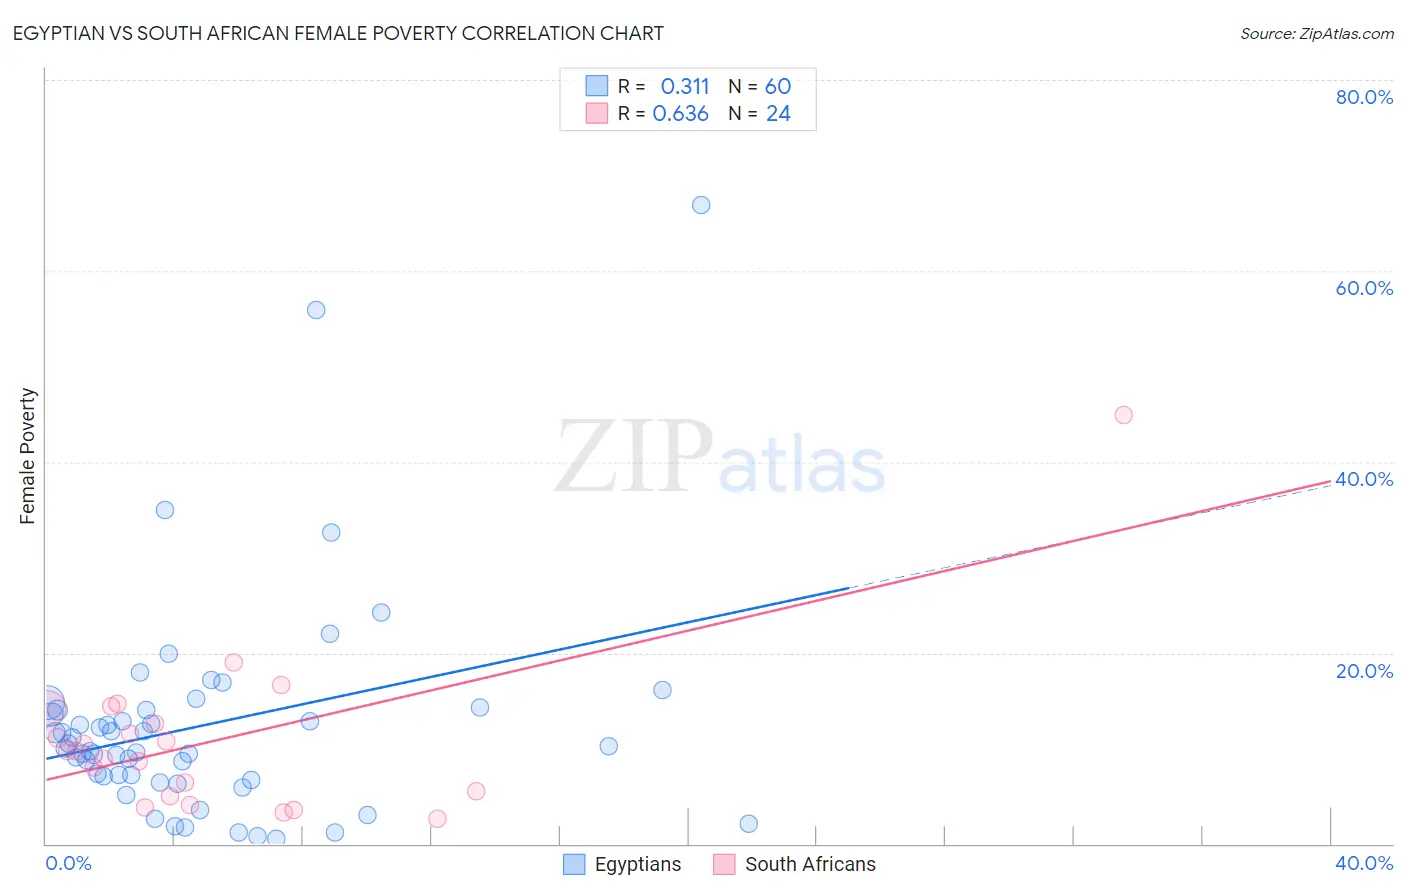
Egyptian vs South African Female Poverty Correlation Chart
The statistical analysis conducted on geographies consisting of 276,729,469 people shows a mild positive correlation between the proportion of Egyptians and poverty level among females in the United States with a correlation coefficient (R) of 0.311 and weighted average of 12.3%. Similarly, the statistical analysis conducted on geographies consisting of 182,540,648 people shows a significant positive correlation between the proportion of South Africans and poverty level among females in the United States with a correlation coefficient (R) of 0.636 and weighted average of 12.8%, a difference of 4.0%.
Female Poverty Correlation Summary
| Measurement | Egyptian | South African |
| Minimum | 0.56% | 2.6% |
| Maximum | 66.9% | 44.9% |
| Range | 66.4% | 42.4% |
| Mean | 12.4% | 10.8% |
| Median | 10.1% | 9.7% |
| Interquartile 25% (IQ1) | 6.9% | 5.3% |
| Interquartile 75% (IQ3) | 14.0% | 13.4% |
| Interquartile Range (IQR) | 7.1% | 8.1% |
| Standard Deviation (Sample) | 11.5% | 8.5% |
| Standard Deviation (Population) | 11.4% | 8.4% |
Similar Demographics by Female Poverty
Demographics Similar to Egyptians by Female Poverty
In terms of female poverty, the demographic groups most similar to Egyptians are Serbian (12.3%, a difference of 0.010%), Immigrants from Eastern Europe (12.3%, a difference of 0.040%), Immigrants from North America (12.3%, a difference of 0.070%), Slovak (12.3%, a difference of 0.12%), and Immigrants from Sweden (12.3%, a difference of 0.12%).
| Demographics | Rating | Rank | Female Poverty |
| Carpatho Rusyns | 97.6 /100 | #71 | Exceptional 12.2% |
| Cambodians | 97.5 /100 | #72 | Exceptional 12.2% |
| Zimbabweans | 97.5 /100 | #73 | Exceptional 12.3% |
| Immigrants | Canada | 97.5 /100 | #74 | Exceptional 12.3% |
| Europeans | 97.4 /100 | #75 | Exceptional 12.3% |
| Immigrants | Eastern Europe | 97.2 /100 | #76 | Exceptional 12.3% |
| Serbians | 97.2 /100 | #77 | Exceptional 12.3% |
| Egyptians | 97.2 /100 | #78 | Exceptional 12.3% |
| Immigrants | North America | 97.1 /100 | #79 | Exceptional 12.3% |
| Slovaks | 97.1 /100 | #80 | Exceptional 12.3% |
| Immigrants | Sweden | 97.1 /100 | #81 | Exceptional 12.3% |
| Jordanians | 97.1 /100 | #82 | Exceptional 12.3% |
| Immigrants | England | 96.9 /100 | #83 | Exceptional 12.3% |
| Northern Europeans | 96.6 /100 | #84 | Exceptional 12.4% |
| Irish | 96.5 /100 | #85 | Exceptional 12.4% |
Demographics Similar to South Africans by Female Poverty
In terms of female poverty, the demographic groups most similar to South Africans are Immigrants from Belarus (12.8%, a difference of 0.040%), Immigrants from Ukraine (12.8%, a difference of 0.11%), Immigrants from Brazil (12.8%, a difference of 0.11%), Argentinean (12.8%, a difference of 0.18%), and Immigrants from Norway (12.8%, a difference of 0.23%).
| Demographics | Rating | Rank | Female Poverty |
| New Zealanders | 90.6 /100 | #120 | Exceptional 12.7% |
| Immigrants | Hungary | 90.3 /100 | #121 | Exceptional 12.7% |
| French Canadians | 90.2 /100 | #122 | Exceptional 12.7% |
| Immigrants | South Eastern Asia | 89.9 /100 | #123 | Excellent 12.7% |
| Immigrants | Norway | 89.3 /100 | #124 | Excellent 12.8% |
| Argentineans | 89.1 /100 | #125 | Excellent 12.8% |
| Immigrants | Ukraine | 88.8 /100 | #126 | Excellent 12.8% |
| South Africans | 88.4 /100 | #127 | Excellent 12.8% |
| Immigrants | Belarus | 88.2 /100 | #128 | Excellent 12.8% |
| Immigrants | Brazil | 87.9 /100 | #129 | Excellent 12.8% |
| Immigrants | Vietnam | 87.1 /100 | #130 | Excellent 12.8% |
| Immigrants | Argentina | 87.0 /100 | #131 | Excellent 12.8% |
| Immigrants | Jordan | 86.9 /100 | #132 | Excellent 12.8% |
| Immigrants | Western Europe | 86.6 /100 | #133 | Excellent 12.8% |
| Immigrants | Switzerland | 85.8 /100 | #134 | Excellent 12.9% |