Immigrants from Kazakhstan vs Bermudan Married-couple Households

COMPARE

Immigrants from Kazakhstan
Race
Ancestry
AfghanAfricanAlaska NativeAlaskan AthabascanAlbanianAleutAlsatianAmericanApacheArabArapahoArgentineanArmenianAssyrian/Chaldean/SyriacAustralianAustrianBahamianBangladeshiBarbadianBasqueBelgianBelizeanBhutaneseBlackfeetBolivianBrazilianBritishBritish West IndianBulgarianBurmeseCajunCambodianCanadianCape VerdeanCarpatho RusynCelticCentral AmericanCentral American IndianCherokeeCheyenneChickasawChileanChineseChippewaChoctawColombianColvilleComancheCosta RicanCreeCreekCroatianCrowCubanCypriotCzechCzechoslovakianDanishDelawareDominicanDutchDutch West IndianEastern EuropeanEcuadorianEgyptianEnglishEstonianEthiopianEuropeanFijianFilipinoFinnishFrenchFrench American IndianFrench CanadianGermanGerman RussianGhanaianGreekGuamanian/ChamorroGuatemalanGuyaneseHaitianHmongHonduranHopiHoumaHungarianIcelanderIndian (Asian)IndonesianInupiatIranianIraqiIrishIroquoisIsraeliItalianJamaicanJapaneseJordanianKenyanKiowaKoreanLaotianLatvianLebaneseLiberianLithuanianLumbeeLuxembourgerMacedonianMalaysianMalteseMarshalleseMenomineeMexicanMexican American IndianMongolianMoroccanNative HawaiianNavajoNepaleseNew ZealanderNicaraguanNigerianNorthern EuropeanNorwegianOkinawanOsageOttawaPaiutePakistaniPalestinianPanamanianParaguayanPennsylvania GermanPeruvianPimaPolishPortuguesePotawatomiPuebloPuerto RicanPuget Sound SalishRomanianRussianSalvadoranSamoanScandinavianScotch-IrishScottishSeminoleSenegaleseSerbianShoshoneSierra LeoneanSiouxSlavicSlovakSloveneSomaliSouth AfricanSouth AmericanSouth American IndianSoviet UnionSpaniardSpanishSpanish AmericanSpanish American IndianSri LankanSubsaharan AfricanSudaneseSwedishSwissSyrianTaiwaneseThaiTlingit-HaidaTohono O'OdhamTonganTrinidadian and TobagonianTsimshianTurkishU.S. Virgin IslanderUgandanUkrainianUruguayanUteVenezuelanVietnameseWelshWest IndianYakamaYaquiYugoslavianYumanYup'ikZimbabwean
Immigration
NonimmigrantsImmigrantsAfghanistanAfricaAlbaniaArgentinaArmeniaAsiaAustraliaAustriaBahamasBangladeshBarbadosBelarusBelgiumBelizeBoliviaBosnia and HerzegovinaBrazilBulgariaBurma/MyanmarCabo VerdeCambodiaCameroonCanadaCaribbeanCentral AmericaChileChinaColombiaCongoCosta RicaCroatiaCubaCzechoslovakiaDenmarkDominicaDominican RepublicEastern AfricaEastern AsiaEastern EuropeEcuadorEgyptEl SalvadorEnglandEritreaEthiopiaEuropeFijiFranceGermanyGhanaGreeceGrenadaGuatemalaGuyanaHaitiHondurasHong KongHungaryIndiaIndonesiaIranIraqIrelandIsraelItalyJamaicaJapanJordanKazakhstanKenyaKoreaKuwaitLaosLatin AmericaLatviaLebanonLiberiaLithuaniaMalaysiaMexicoMicronesiaMiddle AfricaMoldovaMoroccoNepalNetherlandsNicaraguaNigeriaNorth AmericaNorth MacedoniaNorthern AfricaNorthern EuropeNorwayOceaniaPakistanPanamaPeruPhilippinesPolandPortugalRomaniaRussiaSaudi ArabiaScotlandSenegalSerbiaSierra LeoneSingaporeSomaliaSouth AfricaSouth AmericaSouth Central AsiaSouth Eastern AsiaSouthern EuropeSpainSri LankaSt. Vincent and the GrenadinesSudanSwedenSwitzerlandSyriaTaiwanThailandTrinidad and TobagoTurkeyUgandaUkraineUruguayUzbekistanVenezuelaVietnamWest IndiesWestern AfricaWestern AsiaWestern EuropeYemenZaireZimbabweAzores
Bermudan
Race
Ancestry
AfghanAfricanAlaska NativeAlaskan AthabascanAlbanianAleutAlsatianAmericanApacheArabArapahoArgentineanArmenianAssyrian/Chaldean/SyriacAustralianAustrianBahamianBangladeshiBarbadianBasqueBelgianBelizeanBermudanBhutaneseBlackfeetBolivianBrazilianBritishBritish West IndianBulgarianBurmeseCajunCambodianCanadianCape VerdeanCarpatho RusynCelticCentral AmericanCentral American IndianCherokeeCheyenneChickasawChileanChineseChippewaChoctawColombianColvilleComancheCosta RicanCreeCreekCroatianCrowCubanCypriotCzechCzechoslovakianDanishDelawareDominicanDutchDutch West IndianEastern EuropeanEcuadorianEgyptianEnglishEstonianEthiopianEuropeanFijianFilipinoFinnishFrenchFrench American IndianFrench CanadianGermanGerman RussianGhanaianGreekGuamanian/ChamorroGuatemalanGuyaneseHaitianHmongHonduranHopiHoumaHungarianIcelanderIndian (Asian)IndonesianInupiatIranianIraqiIrishIroquoisIsraeliItalianJamaicanJapaneseJordanianKenyanKiowaKoreanLaotianLatvianLebaneseLiberianLithuanianLumbeeLuxembourgerMacedonianMalaysianMalteseMarshalleseMenomineeMexicanMexican American IndianMongolianMoroccanNative HawaiianNavajoNepaleseNew ZealanderNicaraguanNigerianNorthern EuropeanNorwegianOkinawanOsageOttawaPaiutePakistaniPalestinianPanamanianParaguayanPennsylvania GermanPeruvianPimaPolishPortuguesePotawatomiPuebloPuerto RicanPuget Sound SalishRomanianRussianSalvadoranSamoanScandinavianScotch-IrishScottishSeminoleSenegaleseSerbianShoshoneSierra LeoneanSiouxSlavicSlovakSloveneSomaliSouth AfricanSouth AmericanSouth American IndianSoviet UnionSpaniardSpanishSpanish AmericanSpanish American IndianSri LankanSubsaharan AfricanSudaneseSwedishSwissSyrianTaiwaneseThaiTlingit-HaidaTohono O'OdhamTonganTrinidadian and TobagonianTsimshianTurkishU.S. Virgin IslanderUgandanUkrainianUruguayanUteVenezuelanVietnameseWelshWest IndianYakamaYaquiYugoslavianYumanYup'ikZimbabwean
Immigration
NonimmigrantsImmigrantsAfghanistanAfricaAlbaniaArgentinaArmeniaAsiaAustraliaAustriaBahamasBangladeshBarbadosBelarusBelgiumBelizeBoliviaBosnia and HerzegovinaBrazilBulgariaBurma/MyanmarCabo VerdeCambodiaCameroonCanadaCaribbeanCentral AmericaChileChinaColombiaCongoCosta RicaCroatiaCubaCzechoslovakiaDenmarkDominicaDominican RepublicEastern AfricaEastern AsiaEastern EuropeEcuadorEgyptEl SalvadorEnglandEritreaEthiopiaEuropeFijiFranceGermanyGhanaGreeceGrenadaGuatemalaGuyanaHaitiHondurasHong KongHungaryIndiaIndonesiaIranIraqIrelandIsraelItalyJamaicaJapanJordanKenyaKoreaKuwaitLaosLatin AmericaLatviaLebanonLiberiaLithuaniaMalaysiaMexicoMicronesiaMiddle AfricaMoldovaMoroccoNepalNetherlandsNicaraguaNigeriaNorth AmericaNorth MacedoniaNorthern AfricaNorthern EuropeNorwayOceaniaPakistanPanamaPeruPhilippinesPolandPortugalRomaniaRussiaSaudi ArabiaScotlandSenegalSerbiaSierra LeoneSingaporeSomaliaSouth AfricaSouth AmericaSouth Central AsiaSouth Eastern AsiaSouthern EuropeSpainSri LankaSt. Vincent and the GrenadinesSudanSwedenSwitzerlandSyriaTaiwanThailandTrinidad and TobagoTurkeyUgandaUkraineUruguayUzbekistanVenezuelaVietnamWest IndiesWestern AfricaWestern AsiaWestern EuropeYemenZaireZimbabweAzores
Married-couple Households
Income
Poverty
Unemployment
Labor Participation
Family Structure
Vehicle Availability
Education Level
Disability

Married-couple Households Comparison

Immigrants from Kazakhstan

Bermudans

Good
Tragic
46.8%
MARRIED-COUPLE HOUSEHOLDS
70.0/ 100
METRIC RATING
164th/ 347
METRIC RANK
42.4%
MARRIED-COUPLE HOUSEHOLDS
0.0/ 100
METRIC RATING
282nd/ 347
METRIC RANK

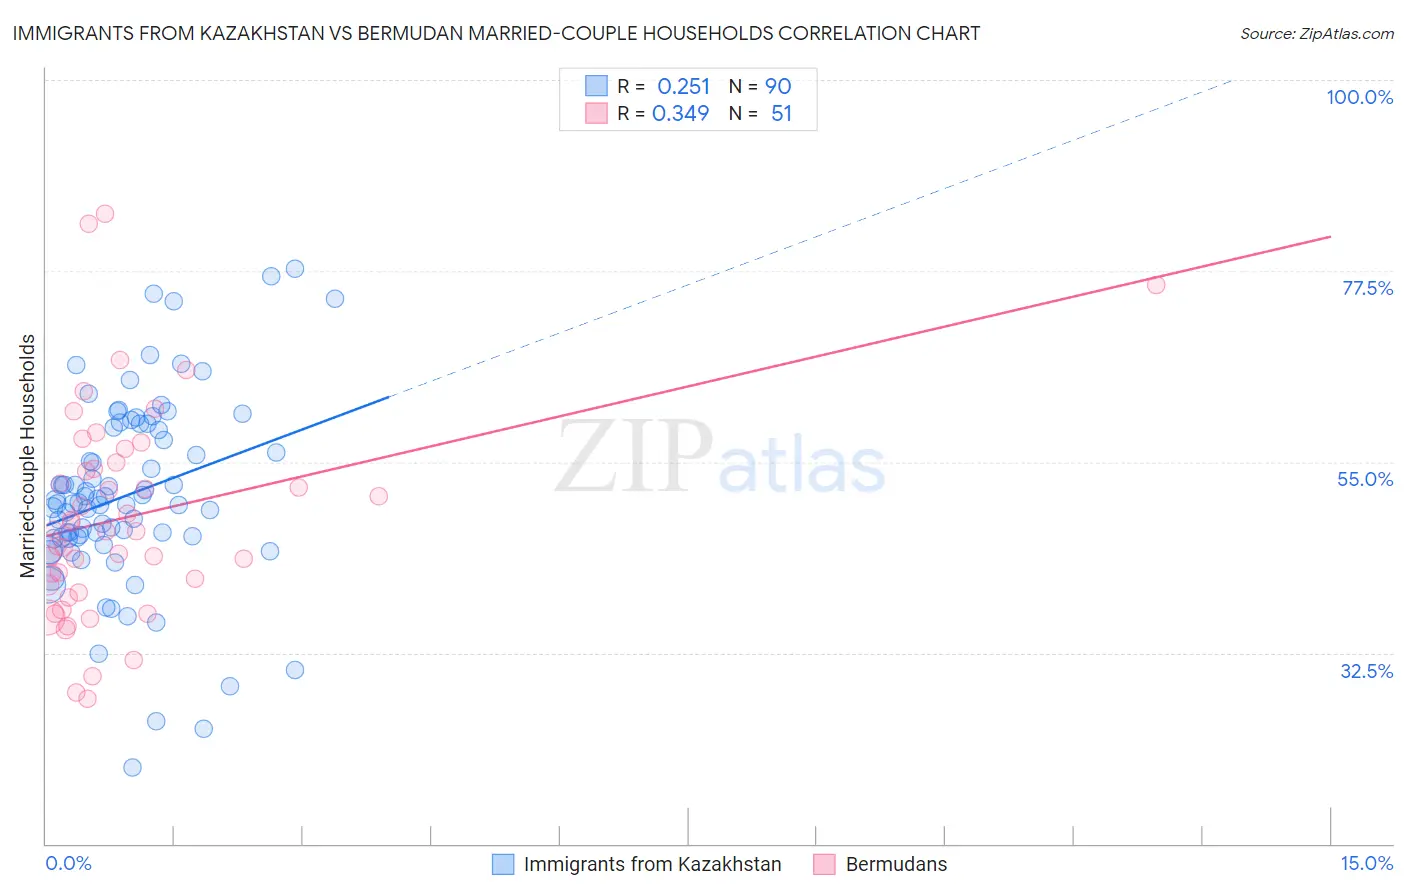
Immigrants from Kazakhstan vs Bermudan Married-couple Households Correlation Chart

The statistical analysis conducted on geographies consisting of 124,426,668 people shows a weak positive correlation between the proportion of Immigrants from Kazakhstan and percentage of married-couple family households in the United States with a correlation coefficient (R) of 0.251 and weighted average of 46.8%. Similarly, the statistical analysis conducted on geographies consisting of 55,716,155 people shows a mild positive correlation between the proportion of Bermudans and percentage of married-couple family households in the United States with a correlation coefficient (R) of 0.349 and weighted average of 42.4%, a difference of 10.3%.
Immigrants from Kazakhstan vs Bermudan Married-couple Households

Married-couple Households Correlation Summary

MeasurementImmigrants from KazakhstanBermudan
Minimum19.0%27.0%
Maximum77.7%84.2%
Range58.8%57.1%
Mean51.1%48.5%
Median50.2%46.9%
Interquartile 25% (IQ1)46.0%39.6%
Interquartile 75% (IQ3)59.1%55.0%
Interquartile Range (IQR)13.0%15.4%
Standard Deviation (Sample)11.1%12.6%
Standard Deviation (Population)11.1%12.5%

Similar Demographics by Married-couple Households

Demographics Similar to Immigrants from Kazakhstan by Married-couple Households

In terms of married-couple households, the demographic groups most similar to Immigrants from Kazakhstan are Immigrants from Southern Europe (46.8%, a difference of 0.0%), Immigrants from Turkey (46.8%, a difference of 0.010%), Colombian (46.8%, a difference of 0.050%), Delaware (46.8%, a difference of 0.060%), and Iraqi (46.9%, a difference of 0.080%).
DemographicsRating | RankMarried-couple Households
Immigrants | Oceania
74.8
/100
|
#157
Good
46.9%
Immigrants | Nonimmigrants
73.3
/100
|
#158
Good
46.9%
Osage
73.2
/100
|
#159
Good
46.9%
Iraqis
71.7
/100
|
#160
Good
46.9%
Delaware
71.2
/100
|
#161
Good
46.8%
Colombians
71.0
/100
|
#162
Good
46.8%
Immigrants | Turkey
70.2
/100
|
#163
Good
46.8%
Immigrants | Kazakhstan
70.0
/100
|
#164
Good
46.8%
Immigrants | Southern Europe
69.9
/100
|
#165
Good
46.8%
Cherokee
65.7
/100
|
#166
Good
46.7%
Immigrants | Croatia
64.2
/100
|
#167
Good
46.7%
Israelis
62.3
/100
|
#168
Good
46.7%
Spanish American Indians
59.4
/100
|
#169
Average
46.6%
South Americans
58.0
/100
|
#170
Average
46.6%
Immigrants | Chile
55.7
/100
|
#171
Average
46.5%

Demographics Similar to Bermudans by Married-couple Households

In terms of married-couple households, the demographic groups most similar to Bermudans are Inupiat (42.4%, a difference of 0.10%), Cheyenne (42.3%, a difference of 0.46%), Ghanaian (42.2%, a difference of 0.49%), Belizean (42.2%, a difference of 0.50%), and Chippewa (42.1%, a difference of 0.73%).
DemographicsRating | RankMarried-couple Households
Immigrants | Bangladesh
0.0
/100
|
#275
Tragic
43.1%
Immigrants | Ethiopia
0.0
/100
|
#276
Tragic
43.1%
Immigrants | Eastern Africa
0.0
/100
|
#277
Tragic
42.9%
Immigrants | Africa
0.0
/100
|
#278
Tragic
42.9%
Sierra Leoneans
0.0
/100
|
#279
Tragic
42.9%
Immigrants | Ecuador
0.0
/100
|
#280
Tragic
42.9%
Immigrants | Guatemala
0.0
/100
|
#281
Tragic
42.8%
Bermudans
0.0
/100
|
#282
Tragic
42.4%
Inupiat
0.0
/100
|
#283
Tragic
42.4%
Cheyenne
0.0
/100
|
#284
Tragic
42.3%
Ghanaians
0.0
/100
|
#285
Tragic
42.2%
Belizeans
0.0
/100
|
#286
Tragic
42.2%
Chippewa
0.0
/100
|
#287
Tragic
42.1%
Immigrants | Eritrea
0.0
/100
|
#288
Tragic
42.1%
Sudanese
0.0
/100
|
#289
Tragic
42.1%