Filipino vs Bermudan Female Poverty
COMPARE
Filipino
Bermudan
Female Poverty
Female Poverty Comparison
Filipinos
Bermudans
10.9%
FEMALE POVERTY
100.0/ 100
METRIC RATING
5th/ 347
METRIC RANK
14.4%
FEMALE POVERTY
5.5/ 100
METRIC RATING
212th/ 347
METRIC RANK
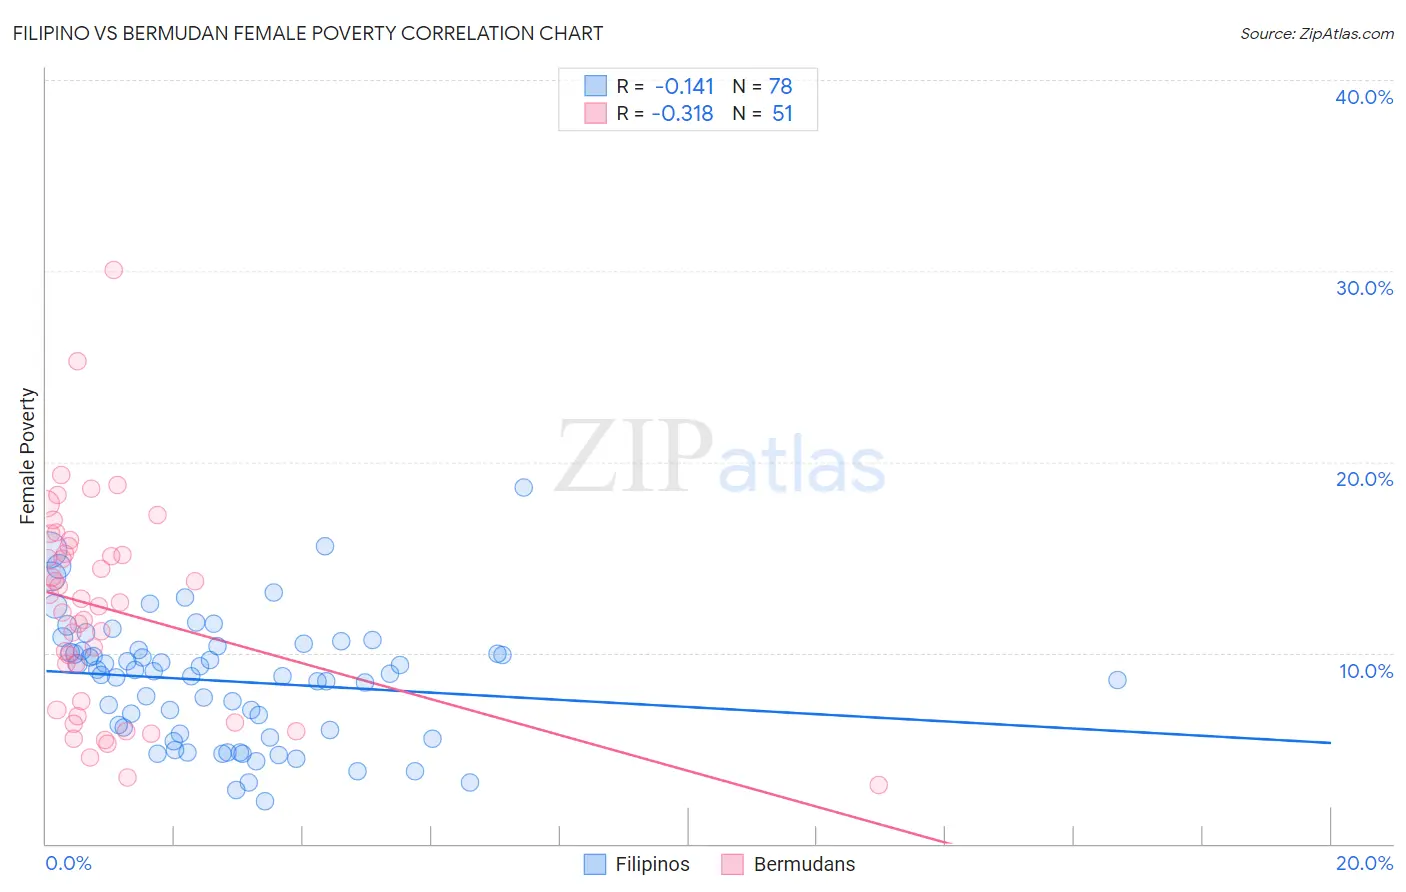
Filipino vs Bermudan Female Poverty Correlation Chart
The statistical analysis conducted on geographies consisting of 254,106,597 people shows a poor negative correlation between the proportion of Filipinos and poverty level among females in the United States with a correlation coefficient (R) of -0.141 and weighted average of 10.9%. Similarly, the statistical analysis conducted on geographies consisting of 55,716,155 people shows a mild negative correlation between the proportion of Bermudans and poverty level among females in the United States with a correlation coefficient (R) of -0.318 and weighted average of 14.4%, a difference of 31.1%.
Female Poverty Correlation Summary
| Measurement | Filipino | Bermudan |
| Minimum | 2.2% | 3.1% |
| Maximum | 18.6% | 30.0% |
| Range | 16.4% | 26.9% |
| Mean | 8.5% | 12.3% |
| Median | 8.9% | 12.6% |
| Interquartile 25% (IQ1) | 5.7% | 7.0% |
| Interquartile 75% (IQ3) | 10.2% | 15.6% |
| Interquartile Range (IQR) | 4.4% | 8.5% |
| Standard Deviation (Sample) | 3.3% | 5.5% |
| Standard Deviation (Population) | 3.2% | 5.5% |
Similar Demographics by Female Poverty
Demographics Similar to Filipinos by Female Poverty
In terms of female poverty, the demographic groups most similar to Filipinos are Immigrants from Ireland (11.0%, a difference of 0.38%), Assyrian/Chaldean/Syriac (11.0%, a difference of 0.75%), Immigrants from South Central Asia (11.1%, a difference of 1.5%), Bulgarian (11.1%, a difference of 1.7%), and Immigrants from Hong Kong (11.2%, a difference of 2.5%).
| Demographics | Rating | Rank | Female Poverty |
| Immigrants | India | 100.0 /100 | #1 | Exceptional 9.9% |
| Chinese | 100.0 /100 | #2 | Exceptional 10.4% |
| Thais | 100.0 /100 | #3 | Exceptional 10.5% |
| Immigrants | Taiwan | 100.0 /100 | #4 | Exceptional 10.5% |
| Filipinos | 100.0 /100 | #5 | Exceptional 10.9% |
| Immigrants | Ireland | 99.9 /100 | #6 | Exceptional 11.0% |
| Assyrians/Chaldeans/Syriacs | 99.9 /100 | #7 | Exceptional 11.0% |
| Immigrants | South Central Asia | 99.9 /100 | #8 | Exceptional 11.1% |
| Bulgarians | 99.9 /100 | #9 | Exceptional 11.1% |
| Immigrants | Hong Kong | 99.9 /100 | #10 | Exceptional 11.2% |
| Maltese | 99.9 /100 | #11 | Exceptional 11.2% |
| Bhutanese | 99.9 /100 | #12 | Exceptional 11.3% |
| Immigrants | Lithuania | 99.9 /100 | #13 | Exceptional 11.3% |
| Lithuanians | 99.8 /100 | #14 | Exceptional 11.4% |
| Latvians | 99.8 /100 | #15 | Exceptional 11.4% |
Demographics Similar to Bermudans by Female Poverty
In terms of female poverty, the demographic groups most similar to Bermudans are Alaskan Athabascan (14.4%, a difference of 0.080%), Marshallese (14.4%, a difference of 0.24%), Immigrants from Panama (14.4%, a difference of 0.39%), Immigrants from Thailand (14.4%, a difference of 0.47%), and Immigrants (14.4%, a difference of 0.51%).
| Demographics | Rating | Rank | Female Poverty |
| Ugandans | 15.4 /100 | #205 | Poor 14.0% |
| Immigrants | Uruguay | 14.0 /100 | #206 | Poor 14.0% |
| Immigrants | Eastern Africa | 9.0 /100 | #207 | Tragic 14.2% |
| Immigrants | Azores | 7.9 /100 | #208 | Tragic 14.2% |
| Panamanians | 7.7 /100 | #209 | Tragic 14.2% |
| Malaysians | 7.4 /100 | #210 | Tragic 14.3% |
| Moroccans | 7.2 /100 | #211 | Tragic 14.3% |
| Bermudans | 5.5 /100 | #212 | Tragic 14.4% |
| Alaskan Athabascans | 5.3 /100 | #213 | Tragic 14.4% |
| Marshallese | 5.0 /100 | #214 | Tragic 14.4% |
| Immigrants | Panama | 4.7 /100 | #215 | Tragic 14.4% |
| Immigrants | Thailand | 4.5 /100 | #216 | Tragic 14.4% |
| Immigrants | Immigrants | 4.5 /100 | #217 | Tragic 14.4% |
| Immigrants | Uzbekistan | 4.4 /100 | #218 | Tragic 14.4% |
| Japanese | 4.1 /100 | #219 | Tragic 14.5% |