Immigrants from Jordan vs Uruguayan Unemployment
COMPARE
Immigrants from Jordan
Uruguayan
Unemployment
Unemployment Comparison
Immigrants from Jordan
Uruguayans
5.1%
UNEMPLOYMENT
86.6/ 100
METRIC RATING
133rd/ 347
METRIC RANK
5.2%
UNEMPLOYMENT
60.2/ 100
METRIC RATING
168th/ 347
METRIC RANK
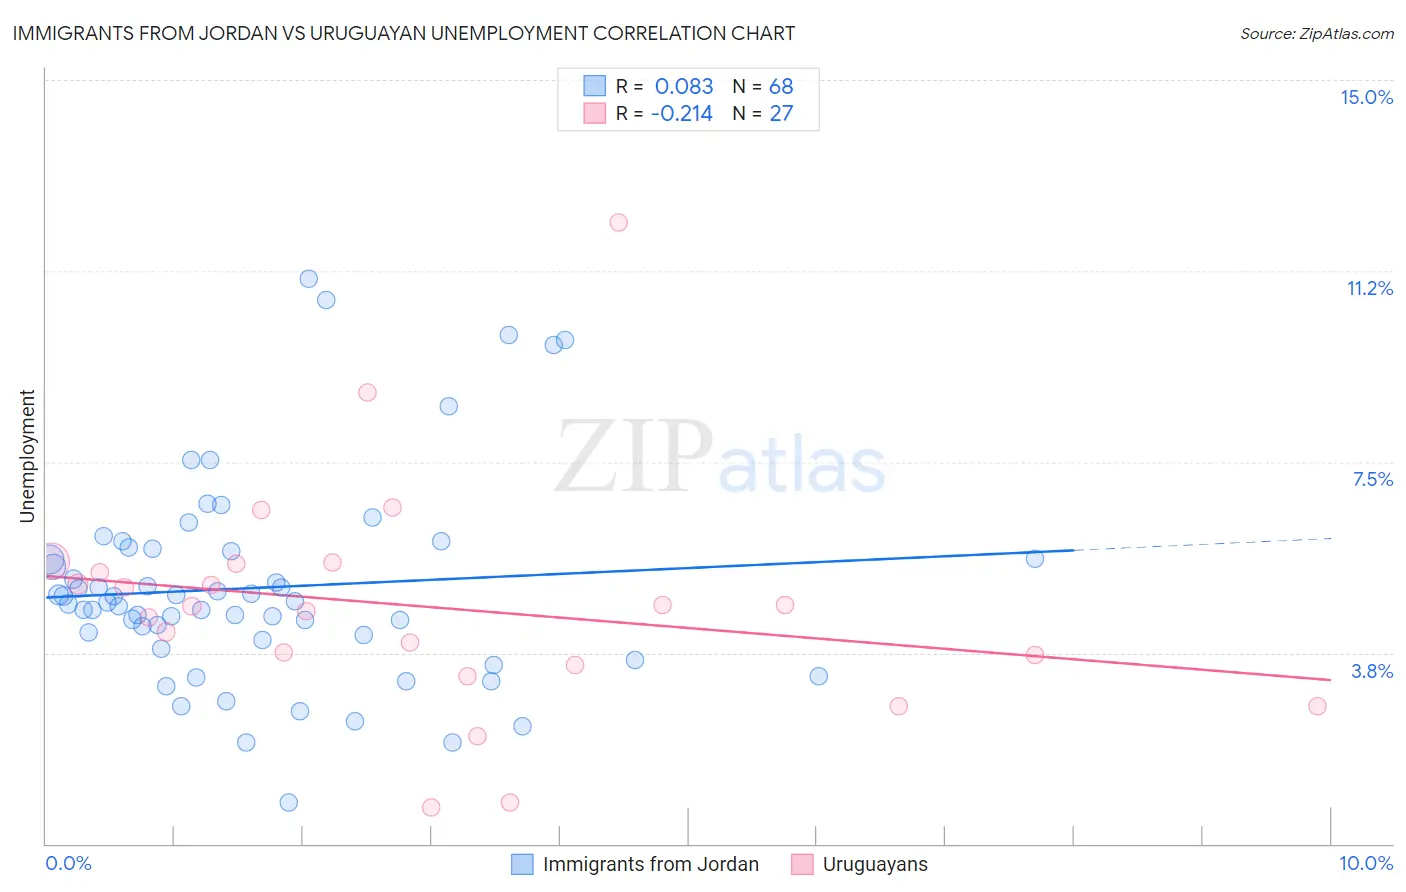
Immigrants from Jordan vs Uruguayan Unemployment Correlation Chart
The statistical analysis conducted on geographies consisting of 181,256,690 people shows a slight positive correlation between the proportion of Immigrants from Jordan and unemployment in the United States with a correlation coefficient (R) of 0.083 and weighted average of 5.1%. Similarly, the statistical analysis conducted on geographies consisting of 144,766,255 people shows a weak negative correlation between the proportion of Uruguayans and unemployment in the United States with a correlation coefficient (R) of -0.214 and weighted average of 5.2%, a difference of 2.3%.
Unemployment Correlation Summary
| Measurement | Immigrants from Jordan | Uruguayan |
| Minimum | 0.80% | 0.70% |
| Maximum | 11.1% | 12.2% |
| Range | 10.3% | 11.5% |
| Mean | 5.0% | 4.7% |
| Median | 4.7% | 4.7% |
| Interquartile 25% (IQ1) | 4.1% | 3.5% |
| Interquartile 75% (IQ3) | 5.8% | 5.5% |
| Interquartile Range (IQR) | 1.7% | 2.0% |
| Standard Deviation (Sample) | 2.0% | 2.3% |
| Standard Deviation (Population) | 2.0% | 2.2% |
Similar Demographics by Unemployment
Demographics Similar to Immigrants from Jordan by Unemployment
In terms of unemployment, the demographic groups most similar to Immigrants from Jordan are Immigrants from Ethiopia (5.1%, a difference of 0.010%), Immigrants from Croatia (5.1%, a difference of 0.020%), Iranian (5.1%, a difference of 0.040%), Immigrants from Europe (5.1%, a difference of 0.040%), and Immigrants from Burma/Myanmar (5.1%, a difference of 0.050%).
| Demographics | Rating | Rank | Unemployment |
| Kenyans | 88.2 /100 | #126 | Excellent 5.1% |
| Immigrants | Kenya | 88.2 /100 | #127 | Excellent 5.1% |
| Immigrants | Eastern Africa | 88.1 /100 | #128 | Excellent 5.1% |
| Immigrants | Latvia | 88.0 /100 | #129 | Excellent 5.1% |
| Iranians | 86.9 /100 | #130 | Excellent 5.1% |
| Immigrants | Croatia | 86.8 /100 | #131 | Excellent 5.1% |
| Immigrants | Ethiopia | 86.7 /100 | #132 | Excellent 5.1% |
| Immigrants | Jordan | 86.6 /100 | #133 | Excellent 5.1% |
| Immigrants | Europe | 86.3 /100 | #134 | Excellent 5.1% |
| Immigrants | Burma/Myanmar | 86.2 /100 | #135 | Excellent 5.1% |
| Immigrants | Spain | 86.2 /100 | #136 | Excellent 5.1% |
| Immigrants | Saudi Arabia | 85.6 /100 | #137 | Excellent 5.1% |
| Immigrants | Hungary | 85.6 /100 | #138 | Excellent 5.1% |
| Pakistanis | 85.3 /100 | #139 | Excellent 5.1% |
| Immigrants | Denmark | 84.3 /100 | #140 | Excellent 5.1% |
Demographics Similar to Uruguayans by Unemployment
In terms of unemployment, the demographic groups most similar to Uruguayans are Immigrants from Indonesia (5.2%, a difference of 0.060%), Colombian (5.2%, a difference of 0.060%), Immigrants from Morocco (5.2%, a difference of 0.070%), Immigrants from Brazil (5.2%, a difference of 0.19%), and Immigrants from Nicaragua (5.2%, a difference of 0.19%).
| Demographics | Rating | Rank | Unemployment |
| Immigrants | Oceania | 65.2 /100 | #161 | Good 5.2% |
| Spanish | 65.1 /100 | #162 | Good 5.2% |
| Immigrants | Zaire | 64.7 /100 | #163 | Good 5.2% |
| Immigrants | Colombia | 64.7 /100 | #164 | Good 5.2% |
| Immigrants | Brazil | 63.1 /100 | #165 | Good 5.2% |
| Immigrants | Indonesia | 61.2 /100 | #166 | Good 5.2% |
| Colombians | 61.1 /100 | #167 | Good 5.2% |
| Uruguayans | 60.2 /100 | #168 | Good 5.2% |
| Immigrants | Morocco | 59.1 /100 | #169 | Average 5.2% |
| Immigrants | Nicaragua | 57.1 /100 | #170 | Average 5.2% |
| Puget Sound Salish | 56.6 /100 | #171 | Average 5.2% |
| Immigrants | Vietnam | 52.5 /100 | #172 | Average 5.2% |
| Immigrants | Poland | 51.8 /100 | #173 | Average 5.3% |
| Immigrants | Congo | 50.0 /100 | #174 | Average 5.3% |
| Taiwanese | 49.6 /100 | #175 | Average 5.3% |