Immigrants from Jordan vs Uruguayan 6th Grade
COMPARE
Immigrants from Jordan
Uruguayan
6th Grade
6th Grade Comparison
Immigrants from Jordan
Uruguayans
97.2%
6TH GRADE
73.0/ 100
METRIC RATING
152nd/ 347
METRIC RANK
96.6%
6TH GRADE
2.5/ 100
METRIC RATING
234th/ 347
METRIC RANK
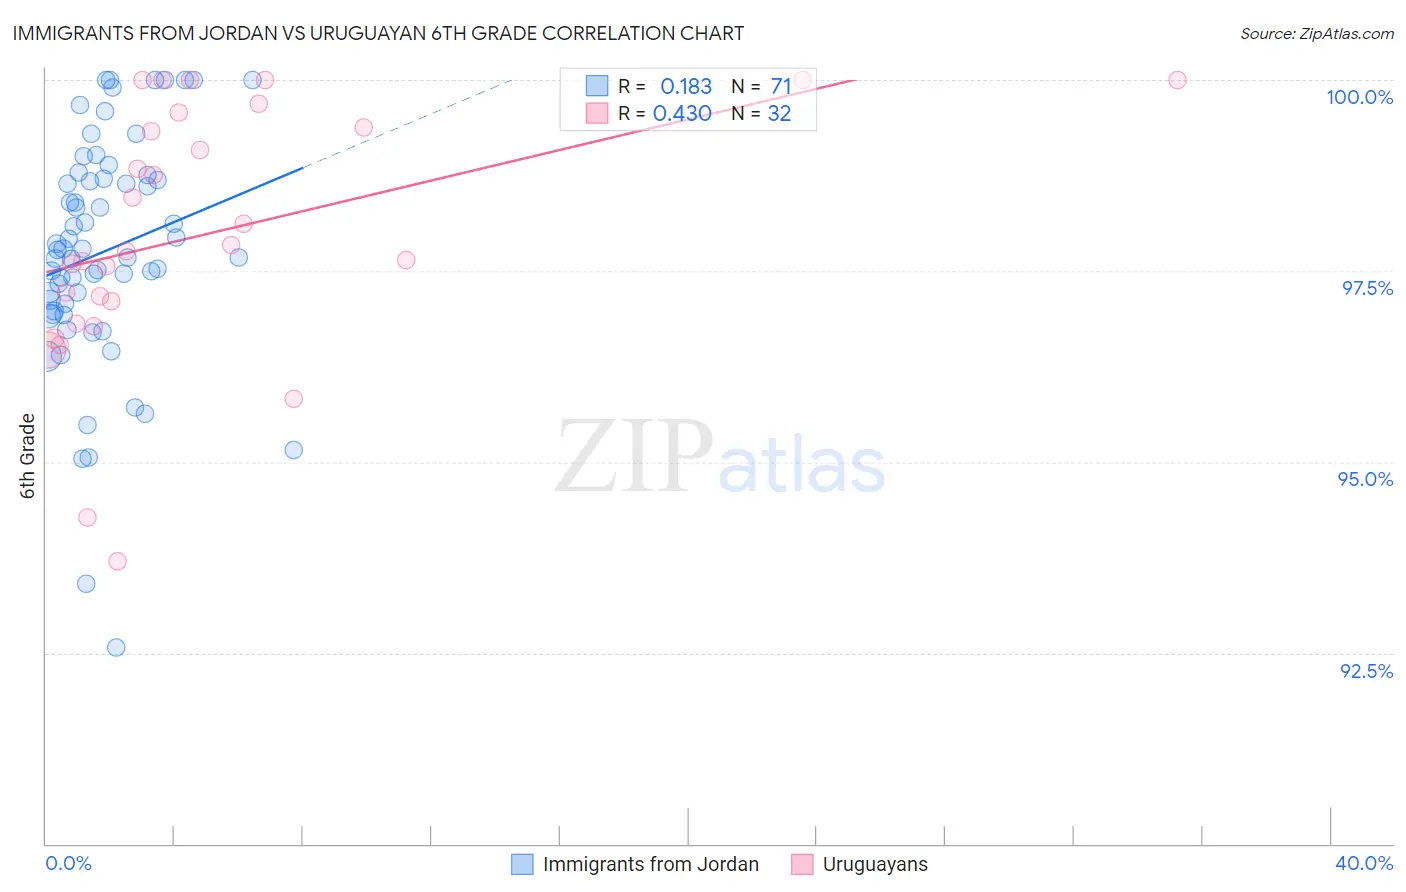
Immigrants from Jordan vs Uruguayan 6th Grade Correlation Chart
The statistical analysis conducted on geographies consisting of 181,269,915 people shows a poor positive correlation between the proportion of Immigrants from Jordan and percentage of population with at least 6th grade education in the United States with a correlation coefficient (R) of 0.183 and weighted average of 97.2%. Similarly, the statistical analysis conducted on geographies consisting of 144,782,794 people shows a moderate positive correlation between the proportion of Uruguayans and percentage of population with at least 6th grade education in the United States with a correlation coefficient (R) of 0.430 and weighted average of 96.6%, a difference of 0.54%.
6th Grade Correlation Summary
| Measurement | Immigrants from Jordan | Uruguayan |
| Minimum | 92.6% | 93.7% |
| Maximum | 100.0% | 100.0% |
| Range | 7.4% | 6.3% |
| Mean | 97.8% | 98.0% |
| Median | 97.8% | 97.8% |
| Interquartile 25% (IQ1) | 97.0% | 97.0% |
| Interquartile 75% (IQ3) | 98.7% | 99.5% |
| Interquartile Range (IQR) | 1.7% | 2.5% |
| Standard Deviation (Sample) | 1.5% | 1.7% |
| Standard Deviation (Population) | 1.5% | 1.6% |
Similar Demographics by 6th Grade
Demographics Similar to Immigrants from Jordan by 6th Grade
In terms of 6th grade, the demographic groups most similar to Immigrants from Jordan are Immigrants from Eastern Europe (97.2%, a difference of 0.0%), Immigrants from Bosnia and Herzegovina (97.2%, a difference of 0.010%), French American Indian (97.2%, a difference of 0.010%), Soviet Union (97.2%, a difference of 0.010%), and Ute (97.1%, a difference of 0.010%).
| Demographics | Rating | Rank | 6th Grade |
| Spaniards | 80.1 /100 | #145 | Excellent 97.2% |
| Hopi | 78.8 /100 | #146 | Good 97.2% |
| Immigrants | South Central Asia | 78.1 /100 | #147 | Good 97.2% |
| Immigrants | Greece | 77.8 /100 | #148 | Good 97.2% |
| Immigrants | Israel | 76.0 /100 | #149 | Good 97.2% |
| Immigrants | Bosnia and Herzegovina | 74.8 /100 | #150 | Good 97.2% |
| French American Indians | 74.0 /100 | #151 | Good 97.2% |
| Immigrants | Jordan | 73.0 /100 | #152 | Good 97.2% |
| Immigrants | Eastern Europe | 72.6 /100 | #153 | Good 97.2% |
| Soviet Union | 71.5 /100 | #154 | Good 97.2% |
| Ute | 71.1 /100 | #155 | Good 97.1% |
| Alsatians | 69.8 /100 | #156 | Good 97.1% |
| Immigrants | Russia | 67.6 /100 | #157 | Good 97.1% |
| Immigrants | Iran | 63.3 /100 | #158 | Good 97.1% |
| Kenyans | 62.9 /100 | #159 | Good 97.1% |
Demographics Similar to Uruguayans by 6th Grade
In terms of 6th grade, the demographic groups most similar to Uruguayans are Asian (96.6%, a difference of 0.0%), Immigrants from Indonesia (96.6%, a difference of 0.010%), Immigrants from Eastern Africa (96.6%, a difference of 0.020%), Yuman (96.7%, a difference of 0.030%), and Nigerian (96.6%, a difference of 0.030%).
| Demographics | Rating | Rank | 6th Grade |
| Immigrants | Western Asia | 4.1 /100 | #227 | Tragic 96.7% |
| Immigrants | Malaysia | 4.0 /100 | #228 | Tragic 96.7% |
| Assyrians/Chaldeans/Syriacs | 4.0 /100 | #229 | Tragic 96.7% |
| Immigrants | Eastern Asia | 4.0 /100 | #230 | Tragic 96.7% |
| Sub-Saharan Africans | 3.5 /100 | #231 | Tragic 96.7% |
| South American Indians | 3.5 /100 | #232 | Tragic 96.7% |
| Yuman | 3.2 /100 | #233 | Tragic 96.7% |
| Uruguayans | 2.5 /100 | #234 | Tragic 96.6% |
| Asians | 2.4 /100 | #235 | Tragic 96.6% |
| Immigrants | Indonesia | 2.3 /100 | #236 | Tragic 96.6% |
| Immigrants | Eastern Africa | 2.0 /100 | #237 | Tragic 96.6% |
| Nigerians | 1.9 /100 | #238 | Tragic 96.6% |
| Indians (Asian) | 1.9 /100 | #239 | Tragic 96.6% |
| Koreans | 1.9 /100 | #240 | Tragic 96.6% |
| Senegalese | 1.8 /100 | #241 | Tragic 96.6% |