Immigrants from Jamaica vs Afghan Male Poverty
COMPARE
Immigrants from Jamaica
Afghan
Male Poverty
Male Poverty Comparison
Immigrants from Jamaica
Afghans
13.3%
MALE POVERTY
0.1/ 100
METRIC RATING
267th/ 347
METRIC RANK
10.9%
MALE POVERTY
71.9/ 100
METRIC RATING
143rd/ 347
METRIC RANK
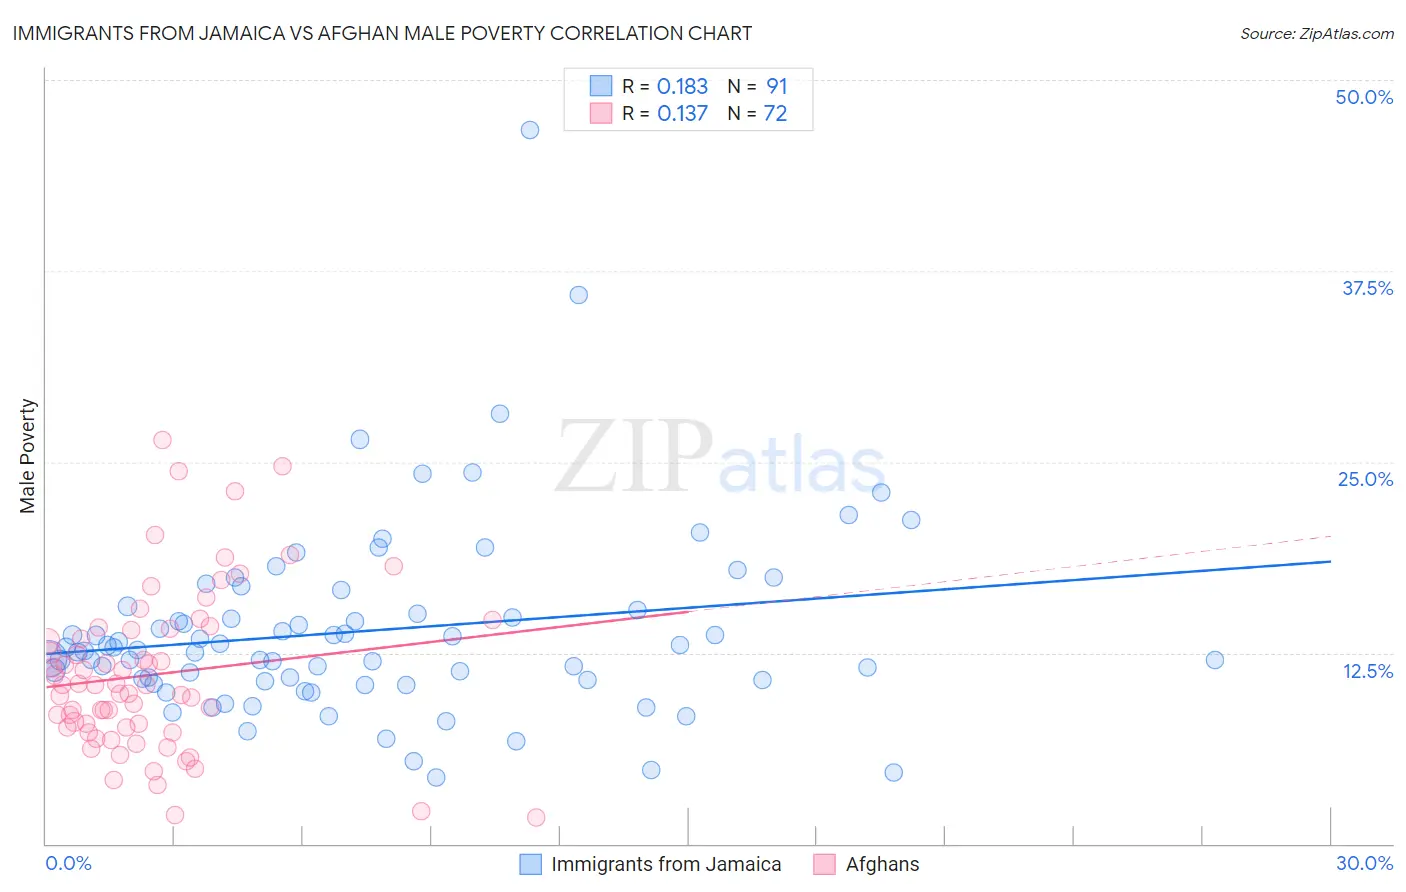
Immigrants from Jamaica vs Afghan Male Poverty Correlation Chart
The statistical analysis conducted on geographies consisting of 301,555,462 people shows a poor positive correlation between the proportion of Immigrants from Jamaica and poverty level among males in the United States with a correlation coefficient (R) of 0.183 and weighted average of 13.3%. Similarly, the statistical analysis conducted on geographies consisting of 148,780,421 people shows a poor positive correlation between the proportion of Afghans and poverty level among males in the United States with a correlation coefficient (R) of 0.137 and weighted average of 10.9%, a difference of 21.2%.
Male Poverty Correlation Summary
| Measurement | Immigrants from Jamaica | Afghan |
| Minimum | 4.3% | 1.7% |
| Maximum | 46.7% | 26.4% |
| Range | 42.4% | 24.7% |
| Mean | 13.9% | 11.1% |
| Median | 12.7% | 10.4% |
| Interquartile 25% (IQ1) | 10.7% | 7.6% |
| Interquartile 75% (IQ3) | 15.3% | 14.0% |
| Interquartile Range (IQR) | 4.6% | 6.4% |
| Standard Deviation (Sample) | 6.2% | 5.3% |
| Standard Deviation (Population) | 6.2% | 5.3% |
Similar Demographics by Male Poverty
Demographics Similar to Immigrants from Jamaica by Male Poverty
In terms of male poverty, the demographic groups most similar to Immigrants from Jamaica are Subsaharan African (13.3%, a difference of 0.030%), Immigrants from Guyana (13.2%, a difference of 0.11%), Guyanese (13.3%, a difference of 0.25%), Jamaican (13.2%, a difference of 0.26%), and Iroquois (13.2%, a difference of 0.28%).
| Demographics | Rating | Rank | Male Poverty |
| Ottawa | 0.1 /100 | #260 | Tragic 13.1% |
| Trinidadians and Tobagonians | 0.1 /100 | #261 | Tragic 13.1% |
| Spanish American Indians | 0.1 /100 | #262 | Tragic 13.1% |
| Central Americans | 0.1 /100 | #263 | Tragic 13.2% |
| Iroquois | 0.1 /100 | #264 | Tragic 13.2% |
| Jamaicans | 0.1 /100 | #265 | Tragic 13.2% |
| Immigrants | Guyana | 0.1 /100 | #266 | Tragic 13.2% |
| Immigrants | Jamaica | 0.1 /100 | #267 | Tragic 13.3% |
| Sub-Saharan Africans | 0.1 /100 | #268 | Tragic 13.3% |
| Guyanese | 0.0 /100 | #269 | Tragic 13.3% |
| Cree | 0.0 /100 | #270 | Tragic 13.3% |
| Spanish Americans | 0.0 /100 | #271 | Tragic 13.4% |
| Immigrants | Bahamas | 0.0 /100 | #272 | Tragic 13.5% |
| Chickasaw | 0.0 /100 | #273 | Tragic 13.5% |
| Immigrants | West Indies | 0.0 /100 | #274 | Tragic 13.5% |
Demographics Similar to Afghans by Male Poverty
In terms of male poverty, the demographic groups most similar to Afghans are Samoan (10.9%, a difference of 0.020%), Immigrants from Germany (10.9%, a difference of 0.040%), Syrian (10.9%, a difference of 0.070%), Basque (10.9%, a difference of 0.34%), and Icelander (11.0%, a difference of 0.41%).
| Demographics | Rating | Rank | Male Poverty |
| Immigrants | Israel | 80.9 /100 | #136 | Excellent 10.8% |
| Immigrants | Switzerland | 79.2 /100 | #137 | Good 10.8% |
| Yugoslavians | 78.2 /100 | #138 | Good 10.8% |
| Immigrants | Jordan | 77.5 /100 | #139 | Good 10.8% |
| Tlingit-Haida | 76.1 /100 | #140 | Good 10.9% |
| Immigrants | France | 75.8 /100 | #141 | Good 10.9% |
| Basques | 74.6 /100 | #142 | Good 10.9% |
| Afghans | 71.9 /100 | #143 | Good 10.9% |
| Samoans | 71.8 /100 | #144 | Good 10.9% |
| Immigrants | Germany | 71.6 /100 | #145 | Good 10.9% |
| Syrians | 71.4 /100 | #146 | Good 10.9% |
| Icelanders | 68.5 /100 | #147 | Good 11.0% |
| Armenians | 68.0 /100 | #148 | Good 11.0% |
| Immigrants | Venezuela | 67.9 /100 | #149 | Good 11.0% |
| Guamanians/Chamorros | 67.6 /100 | #150 | Good 11.0% |