Immigrants from Jamaica vs Afghan Female Poverty Among 18-24 Year Olds
COMPARE
Immigrants from Jamaica
Afghan
Female Poverty Among 18-24 Year Olds
Female Poverty Among 18-24 Year Olds Comparison
Immigrants from Jamaica
Afghans
18.9%
FEMALE POVERTY AMONG 18-24 YEAR OLDS
99.2/ 100
METRIC RATING
87th/ 347
METRIC RANK
19.0%
FEMALE POVERTY AMONG 18-24 YEAR OLDS
99.0/ 100
METRIC RATING
90th/ 347
METRIC RANK
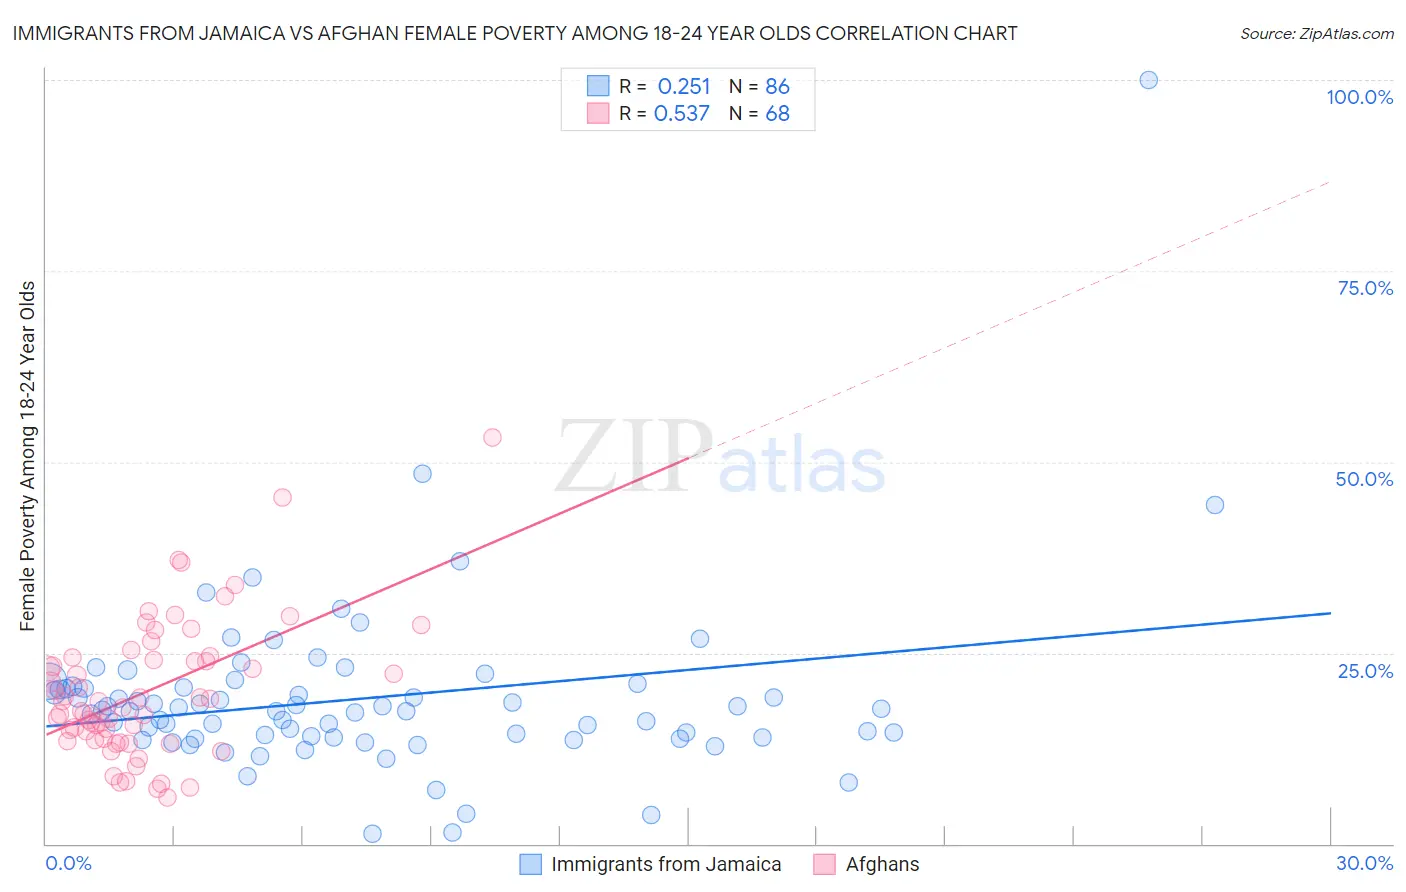
Immigrants from Jamaica vs Afghan Female Poverty Among 18-24 Year Olds Correlation Chart
The statistical analysis conducted on geographies consisting of 296,183,759 people shows a weak positive correlation between the proportion of Immigrants from Jamaica and poverty level among females between the ages 18 and 24 in the United States with a correlation coefficient (R) of 0.251 and weighted average of 18.9%. Similarly, the statistical analysis conducted on geographies consisting of 147,837,560 people shows a substantial positive correlation between the proportion of Afghans and poverty level among females between the ages 18 and 24 in the United States with a correlation coefficient (R) of 0.537 and weighted average of 19.0%, a difference of 0.20%.
Female Poverty Among 18-24 Year Olds Correlation Summary
| Measurement | Immigrants from Jamaica | Afghan |
| Minimum | 1.3% | 6.1% |
| Maximum | 100.0% | 53.1% |
| Range | 98.7% | 47.0% |
| Mean | 19.0% | 19.9% |
| Median | 17.4% | 18.2% |
| Interquartile 25% (IQ1) | 14.0% | 13.6% |
| Interquartile 75% (IQ3) | 20.4% | 24.2% |
| Interquartile Range (IQR) | 6.5% | 10.5% |
| Standard Deviation (Sample) | 11.7% | 9.0% |
| Standard Deviation (Population) | 11.6% | 8.9% |
Demographics Similar to Immigrants from Jamaica and Afghans by Female Poverty Among 18-24 Year Olds
In terms of female poverty among 18-24 year olds, the demographic groups most similar to Immigrants from Jamaica are Immigrants from Iraq (18.9%, a difference of 0.010%), Immigrants from Armenia (18.9%, a difference of 0.090%), Burmese (18.9%, a difference of 0.12%), Croatian (19.0%, a difference of 0.15%), and Immigrants from Cabo Verde (19.0%, a difference of 0.17%). Similarly, the demographic groups most similar to Afghans are Immigrants from Cabo Verde (19.0%, a difference of 0.030%), Croatian (19.0%, a difference of 0.050%), Romanian (19.0%, a difference of 0.090%), Filipino (19.0%, a difference of 0.14%), and Haitian (19.0%, a difference of 0.17%).
| Demographics | Rating | Rank | Female Poverty Among 18-24 Year Olds |
| Immigrants | Europe | 99.5 /100 | #78 | Exceptional 18.8% |
| Uruguayans | 99.5 /100 | #79 | Exceptional 18.8% |
| Palestinians | 99.5 /100 | #80 | Exceptional 18.8% |
| Japanese | 99.5 /100 | #81 | Exceptional 18.8% |
| Immigrants | Uruguay | 99.4 /100 | #82 | Exceptional 18.8% |
| Immigrants | Indonesia | 99.4 /100 | #83 | Exceptional 18.9% |
| Burmese | 99.2 /100 | #84 | Exceptional 18.9% |
| Immigrants | Armenia | 99.2 /100 | #85 | Exceptional 18.9% |
| Immigrants | Iraq | 99.2 /100 | #86 | Exceptional 18.9% |
| Immigrants | Jamaica | 99.2 /100 | #87 | Exceptional 18.9% |
| Croatians | 99.1 /100 | #88 | Exceptional 19.0% |
| Immigrants | Cabo Verde | 99.0 /100 | #89 | Exceptional 19.0% |
| Afghans | 99.0 /100 | #90 | Exceptional 19.0% |
| Romanians | 98.9 /100 | #91 | Exceptional 19.0% |
| Filipinos | 98.9 /100 | #92 | Exceptional 19.0% |
| Haitians | 98.9 /100 | #93 | Exceptional 19.0% |
| Ukrainians | 98.8 /100 | #94 | Exceptional 19.0% |
| Guamanians/Chamorros | 98.8 /100 | #95 | Exceptional 19.0% |
| Sierra Leoneans | 98.7 /100 | #96 | Exceptional 19.0% |
| Salvadorans | 98.4 /100 | #97 | Exceptional 19.1% |
| Immigrants | Jordan | 98.4 /100 | #98 | Exceptional 19.1% |