Immigrants from Chile vs Afghan Male Poverty
COMPARE
Immigrants from Chile
Afghan
Male Poverty
Male Poverty Comparison
Immigrants from Chile
Afghans
11.1%
MALE POVERTY
57.4/ 100
METRIC RATING
162nd/ 347
METRIC RANK
10.9%
MALE POVERTY
71.9/ 100
METRIC RATING
143rd/ 347
METRIC RANK
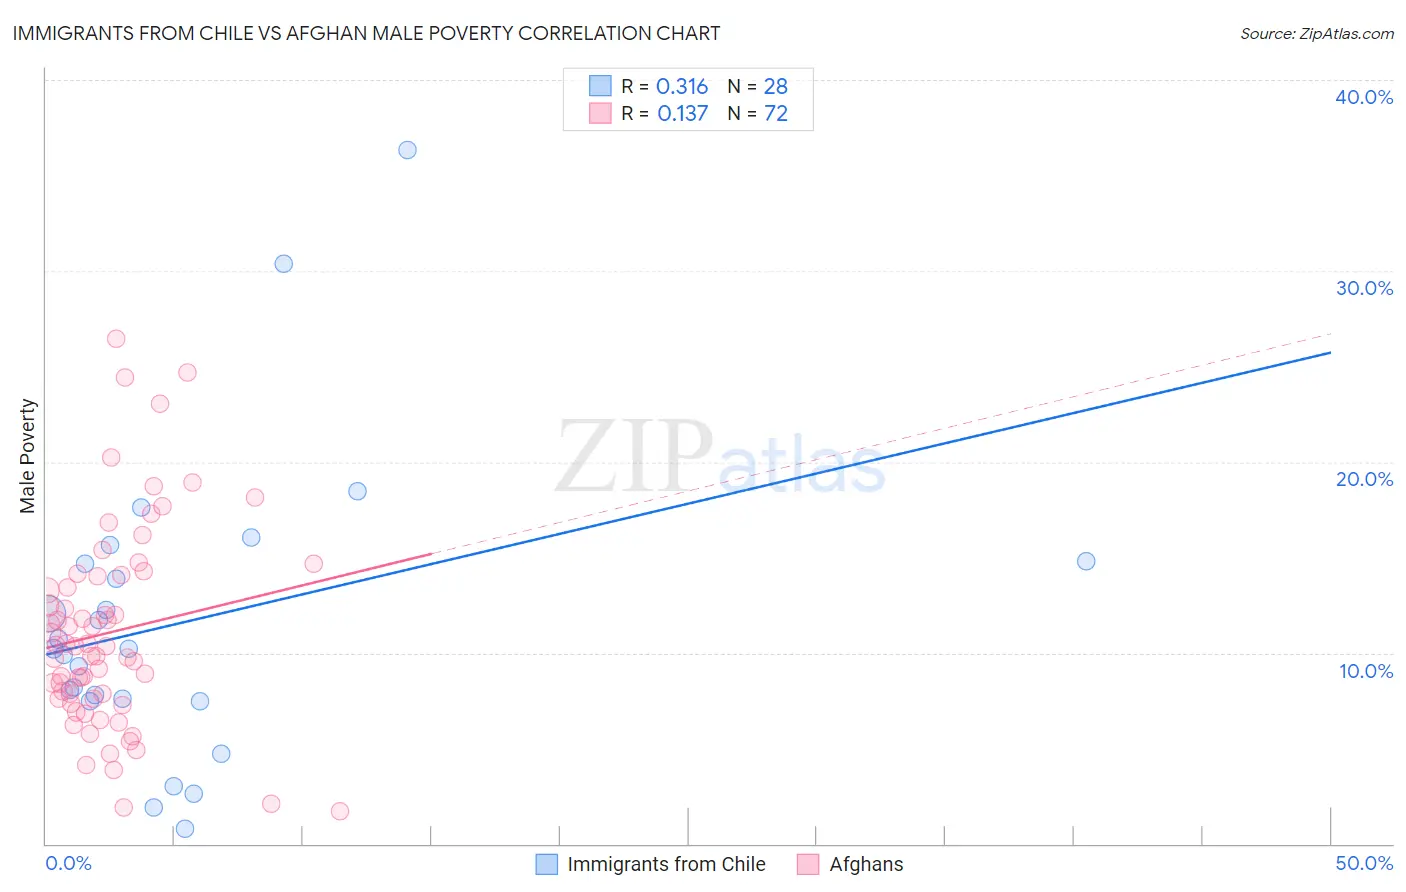
Immigrants from Chile vs Afghan Male Poverty Correlation Chart
The statistical analysis conducted on geographies consisting of 218,566,097 people shows a mild positive correlation between the proportion of Immigrants from Chile and poverty level among males in the United States with a correlation coefficient (R) of 0.316 and weighted average of 11.1%. Similarly, the statistical analysis conducted on geographies consisting of 148,780,421 people shows a poor positive correlation between the proportion of Afghans and poverty level among males in the United States with a correlation coefficient (R) of 0.137 and weighted average of 10.9%, a difference of 1.6%.
Male Poverty Correlation Summary
| Measurement | Immigrants from Chile | Afghan |
| Minimum | 0.80% | 1.7% |
| Maximum | 36.4% | 26.4% |
| Range | 35.6% | 24.7% |
| Mean | 11.6% | 11.1% |
| Median | 10.2% | 10.4% |
| Interquartile 25% (IQ1) | 7.5% | 7.6% |
| Interquartile 75% (IQ3) | 14.8% | 14.0% |
| Interquartile Range (IQR) | 7.2% | 6.4% |
| Standard Deviation (Sample) | 7.8% | 5.3% |
| Standard Deviation (Population) | 7.6% | 5.3% |
Demographics Similar to Immigrants from Chile and Afghans by Male Poverty
In terms of male poverty, the demographic groups most similar to Immigrants from Chile are Immigrants from Northern Africa (11.1%, a difference of 0.23%), Soviet Union (11.1%, a difference of 0.30%), Taiwanese (11.0%, a difference of 0.55%), Colombian (11.0%, a difference of 0.58%), and Scotch-Irish (11.0%, a difference of 0.66%). Similarly, the demographic groups most similar to Afghans are Samoan (10.9%, a difference of 0.020%), Immigrants from Germany (10.9%, a difference of 0.040%), Syrian (10.9%, a difference of 0.070%), Basque (10.9%, a difference of 0.34%), and Icelander (11.0%, a difference of 0.41%).
| Demographics | Rating | Rank | Male Poverty |
| Basques | 74.6 /100 | #142 | Good 10.9% |
| Afghans | 71.9 /100 | #143 | Good 10.9% |
| Samoans | 71.8 /100 | #144 | Good 10.9% |
| Immigrants | Germany | 71.6 /100 | #145 | Good 10.9% |
| Syrians | 71.4 /100 | #146 | Good 10.9% |
| Icelanders | 68.5 /100 | #147 | Good 11.0% |
| Armenians | 68.0 /100 | #148 | Good 11.0% |
| Immigrants | Venezuela | 67.9 /100 | #149 | Good 11.0% |
| Guamanians/Chamorros | 67.6 /100 | #150 | Good 11.0% |
| Venezuelans | 67.4 /100 | #151 | Good 11.0% |
| Immigrants | Nepal | 67.3 /100 | #152 | Good 11.0% |
| Immigrants | Bosnia and Herzegovina | 65.2 /100 | #153 | Good 11.0% |
| Immigrants | Kazakhstan | 64.8 /100 | #154 | Good 11.0% |
| Immigrants | Malaysia | 64.7 /100 | #155 | Good 11.0% |
| Costa Ricans | 63.9 /100 | #156 | Good 11.0% |
| Scotch-Irish | 63.7 /100 | #157 | Good 11.0% |
| Colombians | 63.0 /100 | #158 | Good 11.0% |
| Taiwanese | 62.7 /100 | #159 | Good 11.0% |
| Soviet Union | 60.3 /100 | #160 | Good 11.1% |
| Immigrants | Northern Africa | 59.7 /100 | #161 | Average 11.1% |
| Immigrants | Chile | 57.4 /100 | #162 | Average 11.1% |