Paraguayan vs Afghan Male Poverty
COMPARE
Paraguayan
Afghan
Male Poverty
Male Poverty Comparison
Paraguayans
Afghans
10.2%
MALE POVERTY
97.1/ 100
METRIC RATING
70th/ 347
METRIC RANK
10.9%
MALE POVERTY
71.9/ 100
METRIC RATING
143rd/ 347
METRIC RANK
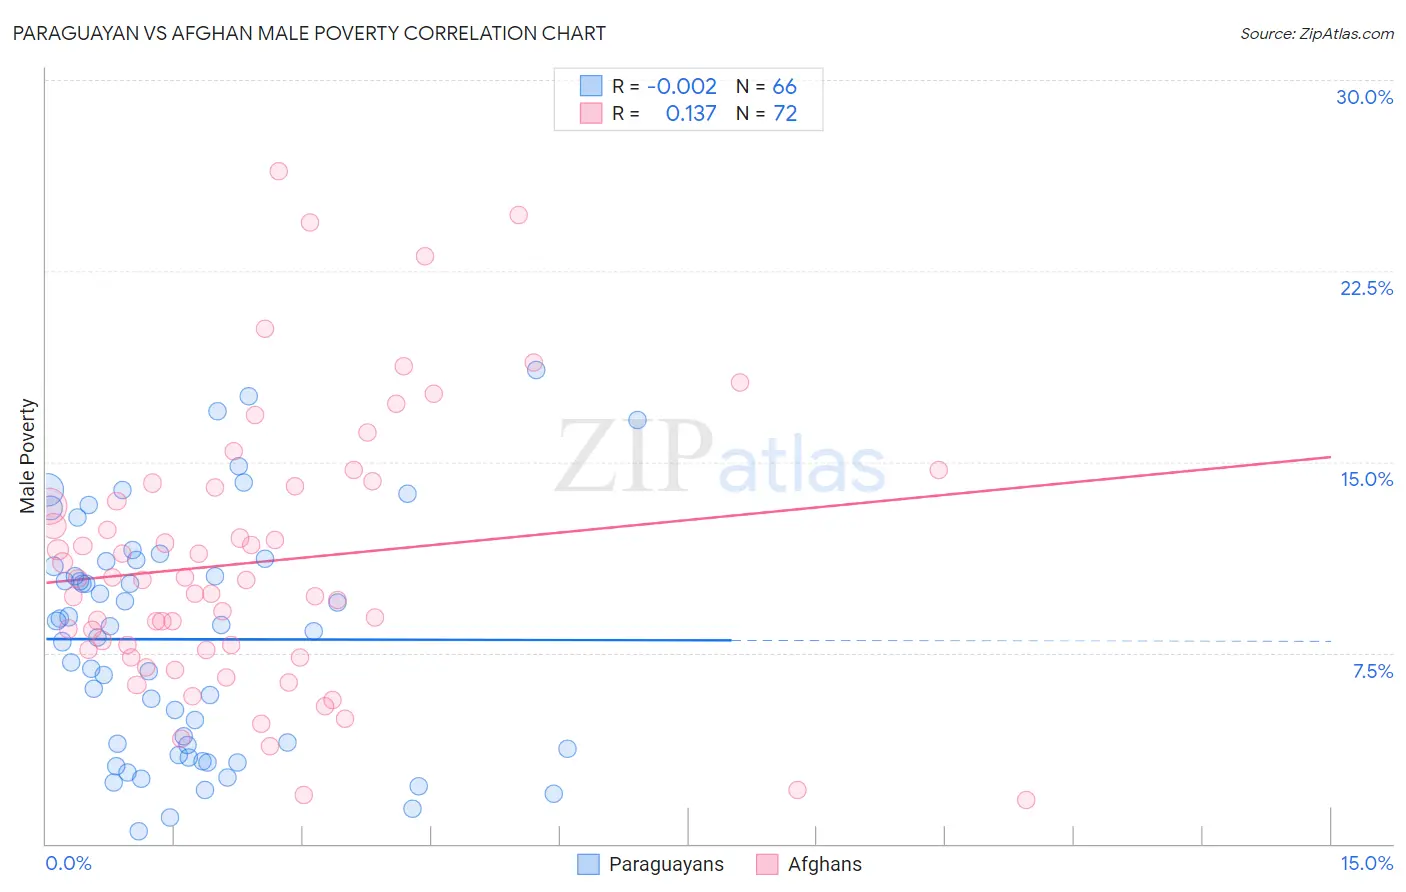
Paraguayan vs Afghan Male Poverty Correlation Chart
The statistical analysis conducted on geographies consisting of 95,091,080 people shows no correlation between the proportion of Paraguayans and poverty level among males in the United States with a correlation coefficient (R) of -0.002 and weighted average of 10.2%. Similarly, the statistical analysis conducted on geographies consisting of 148,780,421 people shows a poor positive correlation between the proportion of Afghans and poverty level among males in the United States with a correlation coefficient (R) of 0.137 and weighted average of 10.9%, a difference of 6.9%.
Male Poverty Correlation Summary
| Measurement | Paraguayan | Afghan |
| Minimum | 0.50% | 1.7% |
| Maximum | 18.6% | 26.4% |
| Range | 18.1% | 24.7% |
| Mean | 8.0% | 11.1% |
| Median | 8.4% | 10.4% |
| Interquartile 25% (IQ1) | 3.8% | 7.6% |
| Interquartile 75% (IQ3) | 11.1% | 14.0% |
| Interquartile Range (IQR) | 7.4% | 6.4% |
| Standard Deviation (Sample) | 4.6% | 5.3% |
| Standard Deviation (Population) | 4.5% | 5.3% |
Similar Demographics by Male Poverty
Demographics Similar to Paraguayans by Male Poverty
In terms of male poverty, the demographic groups most similar to Paraguayans are Immigrants from Australia (10.2%, a difference of 0.020%), European (10.2%, a difference of 0.030%), Immigrants from Canada (10.2%, a difference of 0.030%), Immigrants from Asia (10.2%, a difference of 0.12%), and Immigrants from Sri Lanka (10.2%, a difference of 0.15%).
| Demographics | Rating | Rank | Male Poverty |
| Slovaks | 97.7 /100 | #63 | Exceptional 10.2% |
| Swiss | 97.5 /100 | #64 | Exceptional 10.2% |
| Zimbabweans | 97.5 /100 | #65 | Exceptional 10.2% |
| Serbians | 97.5 /100 | #66 | Exceptional 10.2% |
| Immigrants | Netherlands | 97.3 /100 | #67 | Exceptional 10.2% |
| Immigrants | Sri Lanka | 97.2 /100 | #68 | Exceptional 10.2% |
| Immigrants | Australia | 97.1 /100 | #69 | Exceptional 10.2% |
| Paraguayans | 97.1 /100 | #70 | Exceptional 10.2% |
| Europeans | 97.1 /100 | #71 | Exceptional 10.2% |
| Immigrants | Canada | 97.1 /100 | #72 | Exceptional 10.2% |
| Immigrants | Asia | 97.0 /100 | #73 | Exceptional 10.2% |
| Immigrants | Eastern Europe | 96.9 /100 | #74 | Exceptional 10.2% |
| Carpatho Rusyns | 96.9 /100 | #75 | Exceptional 10.2% |
| Dutch | 96.9 /100 | #76 | Exceptional 10.2% |
| Immigrants | Belgium | 96.8 /100 | #77 | Exceptional 10.3% |
Demographics Similar to Afghans by Male Poverty
In terms of male poverty, the demographic groups most similar to Afghans are Samoan (10.9%, a difference of 0.020%), Immigrants from Germany (10.9%, a difference of 0.040%), Syrian (10.9%, a difference of 0.070%), Basque (10.9%, a difference of 0.34%), and Icelander (11.0%, a difference of 0.41%).
| Demographics | Rating | Rank | Male Poverty |
| Immigrants | Israel | 80.9 /100 | #136 | Excellent 10.8% |
| Immigrants | Switzerland | 79.2 /100 | #137 | Good 10.8% |
| Yugoslavians | 78.2 /100 | #138 | Good 10.8% |
| Immigrants | Jordan | 77.5 /100 | #139 | Good 10.8% |
| Tlingit-Haida | 76.1 /100 | #140 | Good 10.9% |
| Immigrants | France | 75.8 /100 | #141 | Good 10.9% |
| Basques | 74.6 /100 | #142 | Good 10.9% |
| Afghans | 71.9 /100 | #143 | Good 10.9% |
| Samoans | 71.8 /100 | #144 | Good 10.9% |
| Immigrants | Germany | 71.6 /100 | #145 | Good 10.9% |
| Syrians | 71.4 /100 | #146 | Good 10.9% |
| Icelanders | 68.5 /100 | #147 | Good 11.0% |
| Armenians | 68.0 /100 | #148 | Good 11.0% |
| Immigrants | Venezuela | 67.9 /100 | #149 | Good 11.0% |
| Guamanians/Chamorros | 67.6 /100 | #150 | Good 11.0% |