Immigrants from Jamaica vs Dominican Male Poverty
COMPARE
Immigrants from Jamaica
Dominican
Male Poverty
Male Poverty Comparison
Immigrants from Jamaica
Dominicans
13.3%
MALE POVERTY
0.1/ 100
METRIC RATING
267th/ 347
METRIC RANK
16.1%
MALE POVERTY
0.0/ 100
METRIC RATING
329th/ 347
METRIC RANK
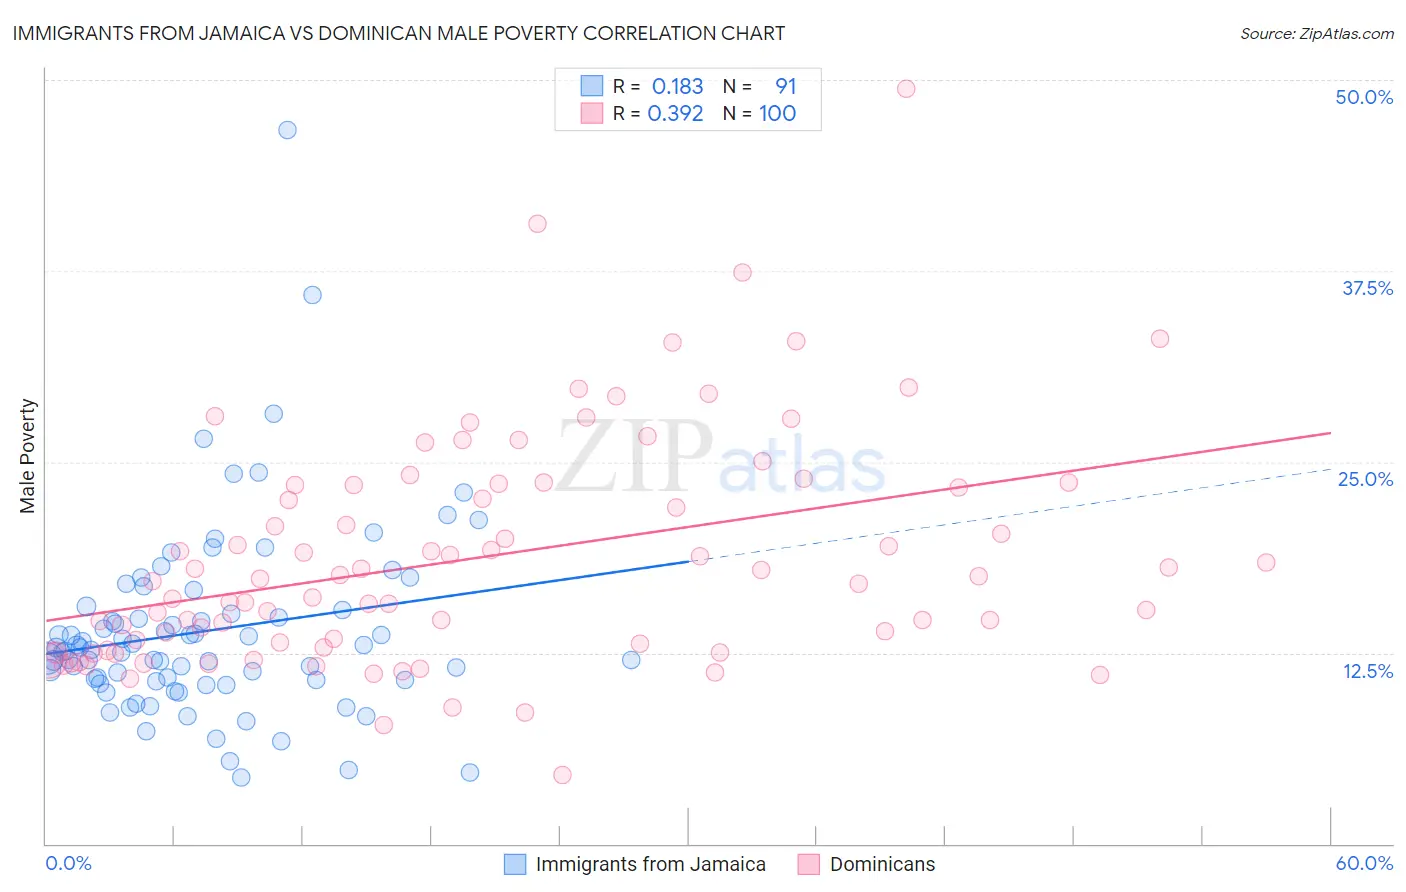
Immigrants from Jamaica vs Dominican Male Poverty Correlation Chart
The statistical analysis conducted on geographies consisting of 301,555,462 people shows a poor positive correlation between the proportion of Immigrants from Jamaica and poverty level among males in the United States with a correlation coefficient (R) of 0.183 and weighted average of 13.3%. Similarly, the statistical analysis conducted on geographies consisting of 354,651,464 people shows a mild positive correlation between the proportion of Dominicans and poverty level among males in the United States with a correlation coefficient (R) of 0.392 and weighted average of 16.1%, a difference of 21.4%.
Male Poverty Correlation Summary
| Measurement | Immigrants from Jamaica | Dominican |
| Minimum | 4.3% | 4.5% |
| Maximum | 46.7% | 49.4% |
| Range | 42.4% | 44.9% |
| Mean | 13.9% | 18.7% |
| Median | 12.7% | 17.2% |
| Interquartile 25% (IQ1) | 10.7% | 13.0% |
| Interquartile 75% (IQ3) | 15.3% | 23.5% |
| Interquartile Range (IQR) | 4.6% | 10.5% |
| Standard Deviation (Sample) | 6.2% | 7.5% |
| Standard Deviation (Population) | 6.2% | 7.5% |
Similar Demographics by Male Poverty
Demographics Similar to Immigrants from Jamaica by Male Poverty
In terms of male poverty, the demographic groups most similar to Immigrants from Jamaica are Subsaharan African (13.3%, a difference of 0.030%), Immigrants from Guyana (13.2%, a difference of 0.11%), Guyanese (13.3%, a difference of 0.25%), Jamaican (13.2%, a difference of 0.26%), and Iroquois (13.2%, a difference of 0.28%).
| Demographics | Rating | Rank | Male Poverty |
| Ottawa | 0.1 /100 | #260 | Tragic 13.1% |
| Trinidadians and Tobagonians | 0.1 /100 | #261 | Tragic 13.1% |
| Spanish American Indians | 0.1 /100 | #262 | Tragic 13.1% |
| Central Americans | 0.1 /100 | #263 | Tragic 13.2% |
| Iroquois | 0.1 /100 | #264 | Tragic 13.2% |
| Jamaicans | 0.1 /100 | #265 | Tragic 13.2% |
| Immigrants | Guyana | 0.1 /100 | #266 | Tragic 13.2% |
| Immigrants | Jamaica | 0.1 /100 | #267 | Tragic 13.3% |
| Sub-Saharan Africans | 0.1 /100 | #268 | Tragic 13.3% |
| Guyanese | 0.0 /100 | #269 | Tragic 13.3% |
| Cree | 0.0 /100 | #270 | Tragic 13.3% |
| Spanish Americans | 0.0 /100 | #271 | Tragic 13.4% |
| Immigrants | Bahamas | 0.0 /100 | #272 | Tragic 13.5% |
| Chickasaw | 0.0 /100 | #273 | Tragic 13.5% |
| Immigrants | West Indies | 0.0 /100 | #274 | Tragic 13.5% |
Demographics Similar to Dominicans by Male Poverty
In terms of male poverty, the demographic groups most similar to Dominicans are Immigrants from Dominican Republic (16.2%, a difference of 0.65%), Ute (16.2%, a difference of 0.99%), Black/African American (15.8%, a difference of 1.7%), Paiute (15.8%, a difference of 1.8%), and Houma (16.7%, a difference of 4.0%).
| Demographics | Rating | Rank | Male Poverty |
| Kiowa | 0.0 /100 | #322 | Tragic 15.2% |
| Colville | 0.0 /100 | #323 | Tragic 15.2% |
| Menominee | 0.0 /100 | #324 | Tragic 15.3% |
| Yakama | 0.0 /100 | #325 | Tragic 15.3% |
| Central American Indians | 0.0 /100 | #326 | Tragic 15.3% |
| Paiute | 0.0 /100 | #327 | Tragic 15.8% |
| Blacks/African Americans | 0.0 /100 | #328 | Tragic 15.8% |
| Dominicans | 0.0 /100 | #329 | Tragic 16.1% |
| Immigrants | Dominican Republic | 0.0 /100 | #330 | Tragic 16.2% |
| Ute | 0.0 /100 | #331 | Tragic 16.2% |
| Houma | 0.0 /100 | #332 | Tragic 16.7% |
| Natives/Alaskans | 0.0 /100 | #333 | Tragic 16.9% |
| Cheyenne | 0.0 /100 | #334 | Tragic 17.6% |
| Apache | 0.0 /100 | #335 | Tragic 17.7% |
| Pueblo | 0.0 /100 | #336 | Tragic 18.5% |