Immigrants from Iraq vs Pakistani Poverty
COMPARE
Immigrants from Iraq
Pakistani
Poverty
Poverty Comparison
Immigrants from Iraq
Pakistanis
12.4%
POVERTY
40.2/ 100
METRIC RATING
183rd/ 347
METRIC RANK
11.9%
POVERTY
82.2/ 100
METRIC RATING
139th/ 347
METRIC RANK
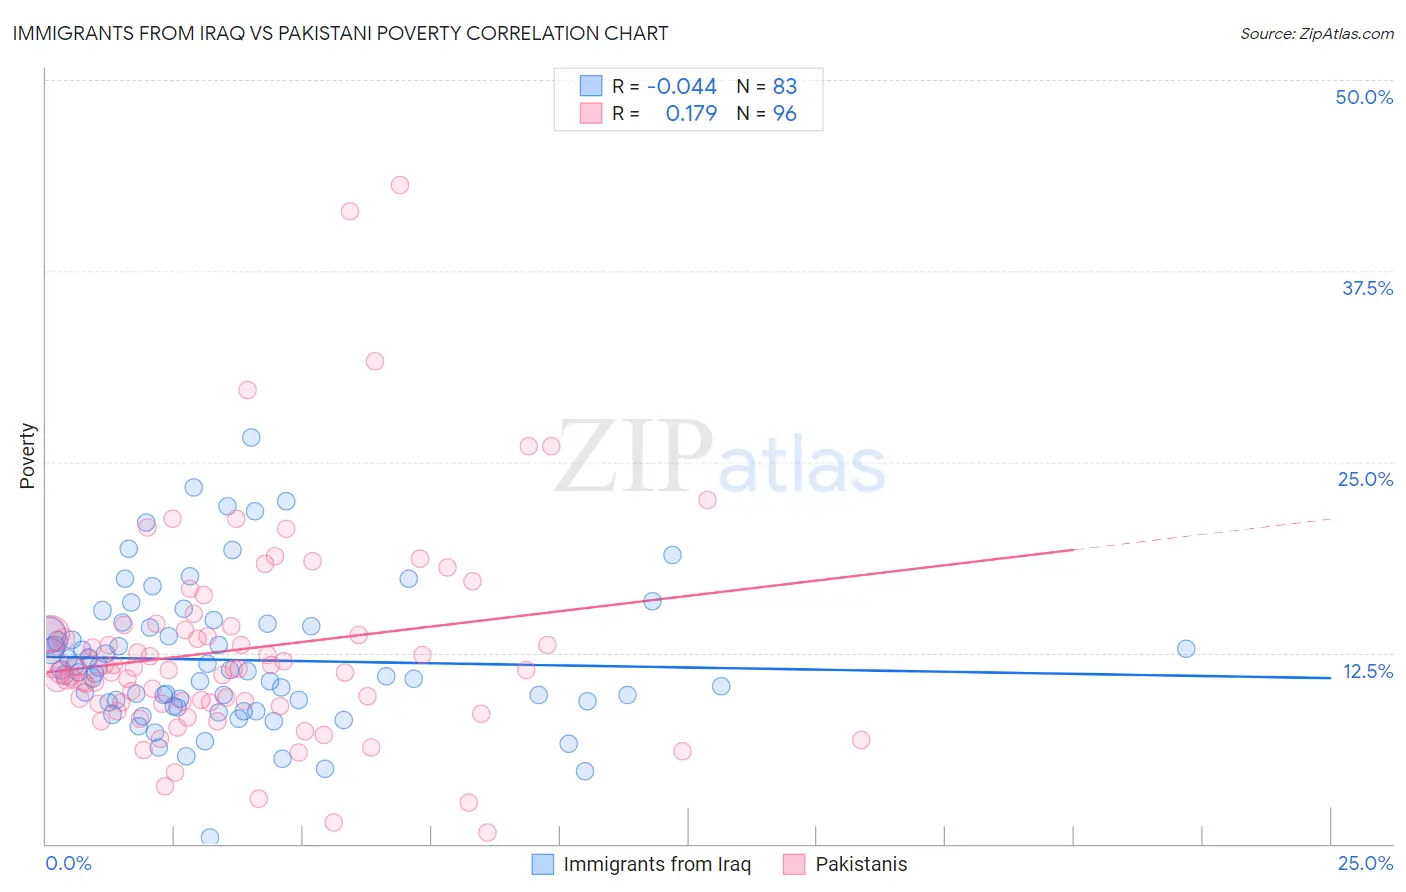
Immigrants from Iraq vs Pakistani Poverty Correlation Chart
The statistical analysis conducted on geographies consisting of 194,714,900 people shows no correlation between the proportion of Immigrants from Iraq and poverty level in the United States with a correlation coefficient (R) of -0.044 and weighted average of 12.4%. Similarly, the statistical analysis conducted on geographies consisting of 335,215,631 people shows a poor positive correlation between the proportion of Pakistanis and poverty level in the United States with a correlation coefficient (R) of 0.179 and weighted average of 11.9%, a difference of 4.9%.
Poverty Correlation Summary
| Measurement | Immigrants from Iraq | Pakistani |
| Minimum | 0.40% | 0.75% |
| Maximum | 26.6% | 43.1% |
| Range | 26.2% | 42.4% |
| Mean | 12.0% | 12.7% |
| Median | 11.2% | 11.4% |
| Interquartile 25% (IQ1) | 9.3% | 9.2% |
| Interquartile 75% (IQ3) | 14.3% | 13.9% |
| Interquartile Range (IQR) | 5.0% | 4.7% |
| Standard Deviation (Sample) | 4.6% | 7.0% |
| Standard Deviation (Population) | 4.6% | 6.9% |
Similar Demographics by Poverty
Demographics Similar to Immigrants from Iraq by Poverty
In terms of poverty, the demographic groups most similar to Immigrants from Iraq are Kenyan (12.5%, a difference of 0.13%), Immigrants from Cameroon (12.4%, a difference of 0.15%), Immigrants from Afghanistan (12.4%, a difference of 0.19%), Mongolian (12.4%, a difference of 0.34%), and Immigrants from Morocco (12.4%, a difference of 0.38%).
| Demographics | Rating | Rank | Poverty |
| Immigrants | Colombia | 47.7 /100 | #176 | Average 12.3% |
| Immigrants | Syria | 47.5 /100 | #177 | Average 12.3% |
| Uruguayans | 44.7 /100 | #178 | Average 12.4% |
| Immigrants | Morocco | 44.0 /100 | #179 | Average 12.4% |
| Mongolians | 43.6 /100 | #180 | Average 12.4% |
| Immigrants | Afghanistan | 42.1 /100 | #181 | Average 12.4% |
| Immigrants | Cameroon | 41.7 /100 | #182 | Average 12.4% |
| Immigrants | Iraq | 40.2 /100 | #183 | Average 12.4% |
| Kenyans | 38.8 /100 | #184 | Fair 12.5% |
| Israelis | 36.4 /100 | #185 | Fair 12.5% |
| Immigrants | Sierra Leone | 36.3 /100 | #186 | Fair 12.5% |
| Hawaiians | 34.1 /100 | #187 | Fair 12.5% |
| Immigrants | Costa Rica | 33.3 /100 | #188 | Fair 12.5% |
| Aleuts | 33.2 /100 | #189 | Fair 12.5% |
| Immigrants | South America | 32.3 /100 | #190 | Fair 12.5% |
Demographics Similar to Pakistanis by Poverty
In terms of poverty, the demographic groups most similar to Pakistanis are Immigrants from Jordan (11.9%, a difference of 0.030%), Immigrants from Switzerland (11.8%, a difference of 0.14%), Immigrants from Peru (11.9%, a difference of 0.19%), Immigrants from France (11.9%, a difference of 0.28%), and Basque (11.9%, a difference of 0.30%).
| Demographics | Rating | Rank | Poverty |
| Peruvians | 85.6 /100 | #132 | Excellent 11.8% |
| Immigrants | Western Europe | 85.2 /100 | #133 | Excellent 11.8% |
| Yugoslavians | 85.2 /100 | #134 | Excellent 11.8% |
| Immigrants | Vietnam | 85.2 /100 | #135 | Excellent 11.8% |
| Chileans | 84.2 /100 | #136 | Excellent 11.8% |
| Immigrants | Switzerland | 83.0 /100 | #137 | Excellent 11.8% |
| Immigrants | Jordan | 82.4 /100 | #138 | Excellent 11.9% |
| Pakistanis | 82.2 /100 | #139 | Excellent 11.9% |
| Immigrants | Peru | 81.1 /100 | #140 | Excellent 11.9% |
| Immigrants | France | 80.5 /100 | #141 | Excellent 11.9% |
| Basques | 80.4 /100 | #142 | Excellent 11.9% |
| Brazilians | 79.7 /100 | #143 | Good 11.9% |
| Icelanders | 77.9 /100 | #144 | Good 11.9% |
| Syrians | 75.1 /100 | #145 | Good 12.0% |
| Afghans | 74.9 /100 | #146 | Good 12.0% |