Immigrants from Iraq vs Native/Alaskan Poverty
COMPARE
Immigrants from Iraq
Native/Alaskan
Poverty
Poverty Comparison
Immigrants from Iraq
Natives/Alaskans
12.4%
POVERTY
40.2/ 100
METRIC RATING
183rd/ 347
METRIC RANK
18.1%
POVERTY
0.0/ 100
METRIC RATING
332nd/ 347
METRIC RANK
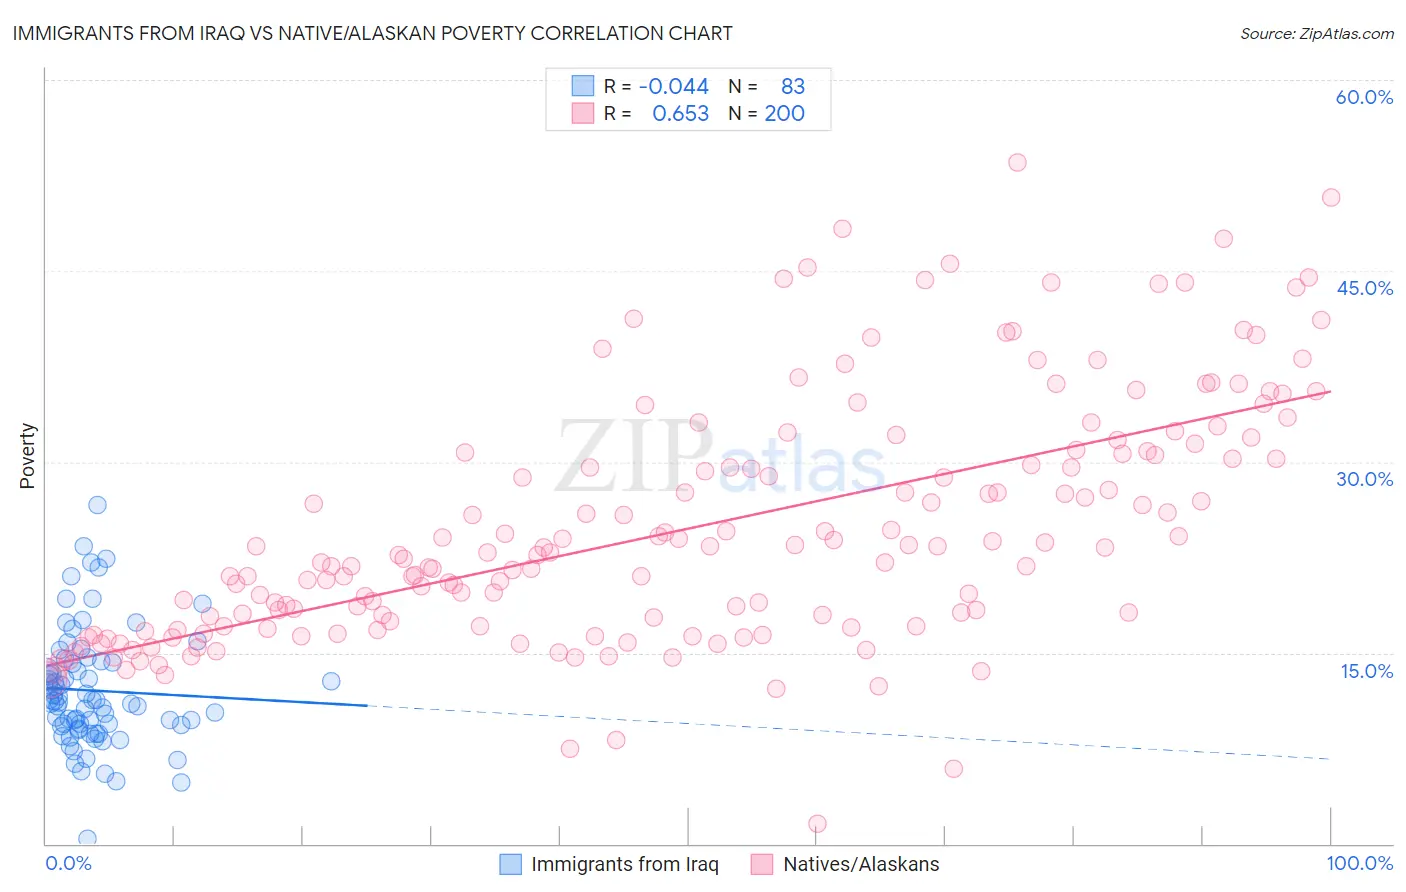
Immigrants from Iraq vs Native/Alaskan Poverty Correlation Chart
The statistical analysis conducted on geographies consisting of 194,714,900 people shows no correlation between the proportion of Immigrants from Iraq and poverty level in the United States with a correlation coefficient (R) of -0.044 and weighted average of 12.4%. Similarly, the statistical analysis conducted on geographies consisting of 512,638,915 people shows a significant positive correlation between the proportion of Natives/Alaskans and poverty level in the United States with a correlation coefficient (R) of 0.653 and weighted average of 18.1%, a difference of 45.2%.
Poverty Correlation Summary
| Measurement | Immigrants from Iraq | Native/Alaskan |
| Minimum | 0.40% | 1.6% |
| Maximum | 26.6% | 53.5% |
| Range | 26.2% | 51.9% |
| Mean | 12.0% | 24.8% |
| Median | 11.2% | 22.8% |
| Interquartile 25% (IQ1) | 9.3% | 17.1% |
| Interquartile 75% (IQ3) | 14.3% | 30.7% |
| Interquartile Range (IQR) | 5.0% | 13.6% |
| Standard Deviation (Sample) | 4.6% | 9.6% |
| Standard Deviation (Population) | 4.6% | 9.5% |
Similar Demographics by Poverty
Demographics Similar to Immigrants from Iraq by Poverty
In terms of poverty, the demographic groups most similar to Immigrants from Iraq are Kenyan (12.5%, a difference of 0.13%), Immigrants from Cameroon (12.4%, a difference of 0.15%), Immigrants from Afghanistan (12.4%, a difference of 0.19%), Mongolian (12.4%, a difference of 0.34%), and Immigrants from Morocco (12.4%, a difference of 0.38%).
| Demographics | Rating | Rank | Poverty |
| Immigrants | Colombia | 47.7 /100 | #176 | Average 12.3% |
| Immigrants | Syria | 47.5 /100 | #177 | Average 12.3% |
| Uruguayans | 44.7 /100 | #178 | Average 12.4% |
| Immigrants | Morocco | 44.0 /100 | #179 | Average 12.4% |
| Mongolians | 43.6 /100 | #180 | Average 12.4% |
| Immigrants | Afghanistan | 42.1 /100 | #181 | Average 12.4% |
| Immigrants | Cameroon | 41.7 /100 | #182 | Average 12.4% |
| Immigrants | Iraq | 40.2 /100 | #183 | Average 12.4% |
| Kenyans | 38.8 /100 | #184 | Fair 12.5% |
| Israelis | 36.4 /100 | #185 | Fair 12.5% |
| Immigrants | Sierra Leone | 36.3 /100 | #186 | Fair 12.5% |
| Hawaiians | 34.1 /100 | #187 | Fair 12.5% |
| Immigrants | Costa Rica | 33.3 /100 | #188 | Fair 12.5% |
| Aleuts | 33.2 /100 | #189 | Fair 12.5% |
| Immigrants | South America | 32.3 /100 | #190 | Fair 12.5% |
Demographics Similar to Natives/Alaskans by Poverty
In terms of poverty, the demographic groups most similar to Natives/Alaskans are Immigrants from Dominican Republic (17.8%, a difference of 1.4%), Houma (18.4%, a difference of 2.0%), Apache (18.4%, a difference of 2.0%), Dominican (17.6%, a difference of 2.4%), and Black/African American (17.3%, a difference of 4.7%).
| Demographics | Rating | Rank | Poverty |
| Central American Indians | 0.0 /100 | #325 | Tragic 16.7% |
| Paiute | 0.0 /100 | #326 | Tragic 16.7% |
| Kiowa | 0.0 /100 | #327 | Tragic 16.8% |
| Ute | 0.0 /100 | #328 | Tragic 16.9% |
| Blacks/African Americans | 0.0 /100 | #329 | Tragic 17.3% |
| Dominicans | 0.0 /100 | #330 | Tragic 17.6% |
| Immigrants | Dominican Republic | 0.0 /100 | #331 | Tragic 17.8% |
| Natives/Alaskans | 0.0 /100 | #332 | Tragic 18.1% |
| Houma | 0.0 /100 | #333 | Tragic 18.4% |
| Apache | 0.0 /100 | #334 | Tragic 18.4% |
| Cheyenne | 0.0 /100 | #335 | Tragic 18.9% |
| Pueblo | 0.0 /100 | #336 | Tragic 19.4% |
| Sioux | 0.0 /100 | #337 | Tragic 19.8% |
| Yuman | 0.0 /100 | #338 | Tragic 20.2% |
| Crow | 0.0 /100 | #339 | Tragic 20.7% |