Immigrants from Iraq vs Immigrants from Burma/Myanmar Poverty
COMPARE
Immigrants from Iraq
Immigrants from Burma/Myanmar
Poverty
Poverty Comparison
Immigrants from Iraq
Immigrants from Burma/Myanmar
12.4%
POVERTY
40.2/ 100
METRIC RATING
183rd/ 347
METRIC RANK
14.2%
POVERTY
0.2/ 100
METRIC RATING
251st/ 347
METRIC RANK
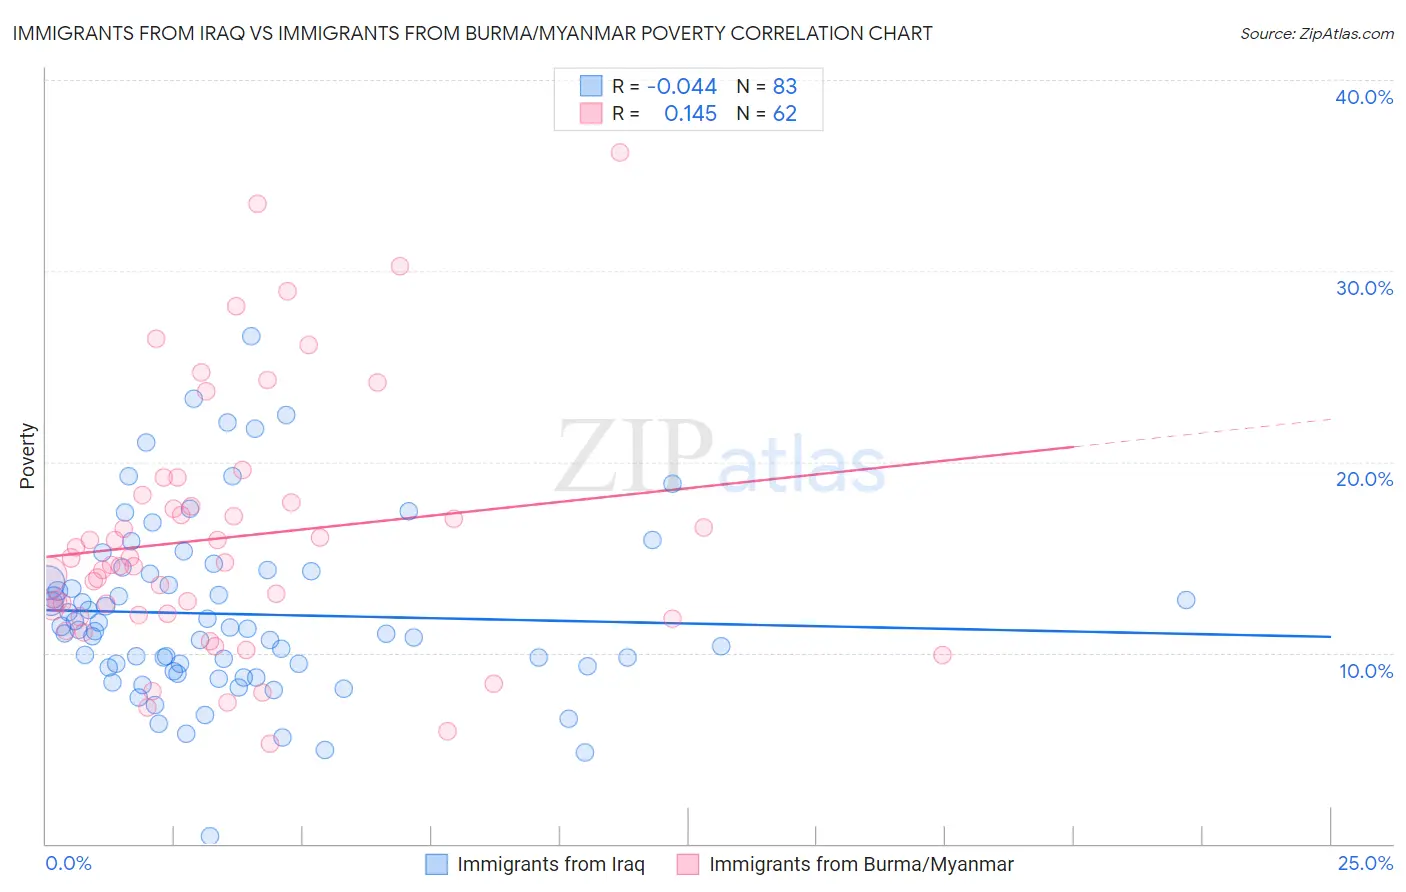
Immigrants from Iraq vs Immigrants from Burma/Myanmar Poverty Correlation Chart
The statistical analysis conducted on geographies consisting of 194,714,900 people shows no correlation between the proportion of Immigrants from Iraq and poverty level in the United States with a correlation coefficient (R) of -0.044 and weighted average of 12.4%. Similarly, the statistical analysis conducted on geographies consisting of 172,278,151 people shows a poor positive correlation between the proportion of Immigrants from Burma/Myanmar and poverty level in the United States with a correlation coefficient (R) of 0.145 and weighted average of 14.2%, a difference of 14.3%.
Poverty Correlation Summary
| Measurement | Immigrants from Iraq | Immigrants from Burma/Myanmar |
| Minimum | 0.40% | 5.2% |
| Maximum | 26.6% | 36.2% |
| Range | 26.2% | 31.0% |
| Mean | 12.0% | 16.0% |
| Median | 11.2% | 14.7% |
| Interquartile 25% (IQ1) | 9.3% | 12.0% |
| Interquartile 75% (IQ3) | 14.3% | 17.9% |
| Interquartile Range (IQR) | 5.0% | 5.9% |
| Standard Deviation (Sample) | 4.6% | 6.6% |
| Standard Deviation (Population) | 4.6% | 6.6% |
Similar Demographics by Poverty
Demographics Similar to Immigrants from Iraq by Poverty
In terms of poverty, the demographic groups most similar to Immigrants from Iraq are Kenyan (12.5%, a difference of 0.13%), Immigrants from Cameroon (12.4%, a difference of 0.15%), Immigrants from Afghanistan (12.4%, a difference of 0.19%), Mongolian (12.4%, a difference of 0.34%), and Immigrants from Morocco (12.4%, a difference of 0.38%).
| Demographics | Rating | Rank | Poverty |
| Immigrants | Colombia | 47.7 /100 | #176 | Average 12.3% |
| Immigrants | Syria | 47.5 /100 | #177 | Average 12.3% |
| Uruguayans | 44.7 /100 | #178 | Average 12.4% |
| Immigrants | Morocco | 44.0 /100 | #179 | Average 12.4% |
| Mongolians | 43.6 /100 | #180 | Average 12.4% |
| Immigrants | Afghanistan | 42.1 /100 | #181 | Average 12.4% |
| Immigrants | Cameroon | 41.7 /100 | #182 | Average 12.4% |
| Immigrants | Iraq | 40.2 /100 | #183 | Average 12.4% |
| Kenyans | 38.8 /100 | #184 | Fair 12.5% |
| Israelis | 36.4 /100 | #185 | Fair 12.5% |
| Immigrants | Sierra Leone | 36.3 /100 | #186 | Fair 12.5% |
| Hawaiians | 34.1 /100 | #187 | Fair 12.5% |
| Immigrants | Costa Rica | 33.3 /100 | #188 | Fair 12.5% |
| Aleuts | 33.2 /100 | #189 | Fair 12.5% |
| Immigrants | South America | 32.3 /100 | #190 | Fair 12.5% |
Demographics Similar to Immigrants from Burma/Myanmar by Poverty
In terms of poverty, the demographic groups most similar to Immigrants from Burma/Myanmar are Cree (14.2%, a difference of 0.090%), Spanish American Indian (14.2%, a difference of 0.11%), Immigrants from Trinidad and Tobago (14.2%, a difference of 0.22%), Immigrants from Ghana (14.2%, a difference of 0.39%), and Immigrants from El Salvador (14.3%, a difference of 0.47%).
| Demographics | Rating | Rank | Poverty |
| Nepalese | 0.3 /100 | #244 | Tragic 14.0% |
| Immigrants | Sudan | 0.3 /100 | #245 | Tragic 14.1% |
| Potawatomi | 0.3 /100 | #246 | Tragic 14.1% |
| Liberians | 0.2 /100 | #247 | Tragic 14.1% |
| Immigrants | Western Africa | 0.2 /100 | #248 | Tragic 14.1% |
| Immigrants | Ghana | 0.2 /100 | #249 | Tragic 14.2% |
| Cree | 0.2 /100 | #250 | Tragic 14.2% |
| Immigrants | Burma/Myanmar | 0.2 /100 | #251 | Tragic 14.2% |
| Spanish American Indians | 0.2 /100 | #252 | Tragic 14.2% |
| Immigrants | Trinidad and Tobago | 0.2 /100 | #253 | Tragic 14.2% |
| Immigrants | El Salvador | 0.1 /100 | #254 | Tragic 14.3% |
| Immigrants | Ecuador | 0.1 /100 | #255 | Tragic 14.3% |
| Mexican American Indians | 0.1 /100 | #256 | Tragic 14.3% |
| Trinidadians and Tobagonians | 0.1 /100 | #257 | Tragic 14.3% |
| Ottawa | 0.1 /100 | #258 | Tragic 14.3% |