Immigrants from Iraq vs Immigrants from Bolivia Poverty
COMPARE
Immigrants from Iraq
Immigrants from Bolivia
Poverty
Poverty Comparison
Immigrants from Iraq
Immigrants from Bolivia
12.4%
POVERTY
40.2/ 100
METRIC RATING
183rd/ 347
METRIC RANK
10.4%
POVERTY
99.8/ 100
METRIC RATING
14th/ 347
METRIC RANK
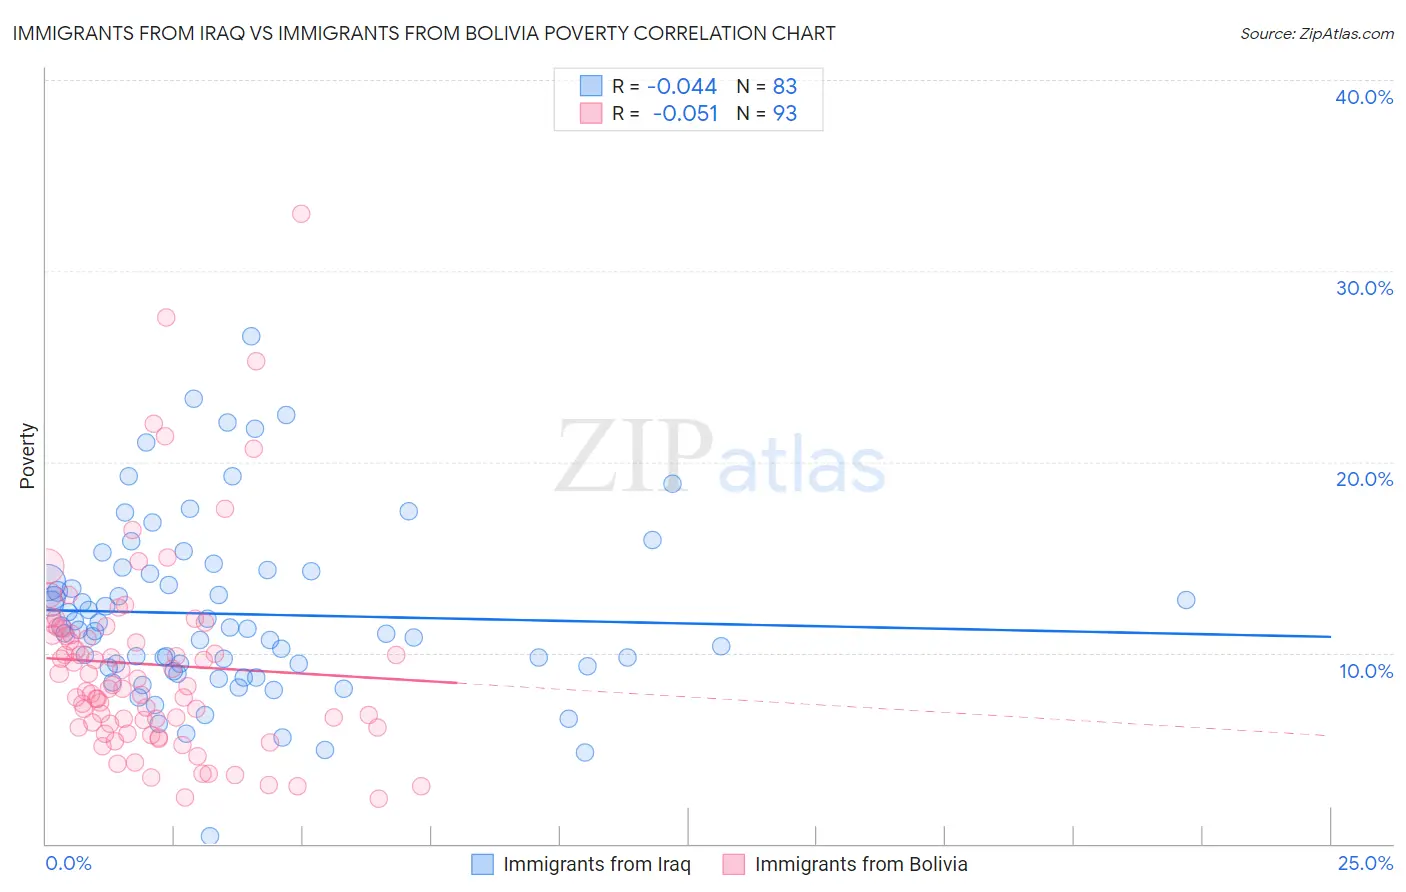
Immigrants from Iraq vs Immigrants from Bolivia Poverty Correlation Chart
The statistical analysis conducted on geographies consisting of 194,714,900 people shows no correlation between the proportion of Immigrants from Iraq and poverty level in the United States with a correlation coefficient (R) of -0.044 and weighted average of 12.4%. Similarly, the statistical analysis conducted on geographies consisting of 158,712,653 people shows a slight negative correlation between the proportion of Immigrants from Bolivia and poverty level in the United States with a correlation coefficient (R) of -0.051 and weighted average of 10.4%, a difference of 19.1%.
Poverty Correlation Summary
| Measurement | Immigrants from Iraq | Immigrants from Bolivia |
| Minimum | 0.40% | 2.3% |
| Maximum | 26.6% | 33.0% |
| Range | 26.2% | 30.6% |
| Mean | 12.0% | 9.4% |
| Median | 11.2% | 8.2% |
| Interquartile 25% (IQ1) | 9.3% | 6.2% |
| Interquartile 75% (IQ3) | 14.3% | 11.1% |
| Interquartile Range (IQR) | 5.0% | 4.9% |
| Standard Deviation (Sample) | 4.6% | 5.3% |
| Standard Deviation (Population) | 4.6% | 5.3% |
Similar Demographics by Poverty
Demographics Similar to Immigrants from Iraq by Poverty
In terms of poverty, the demographic groups most similar to Immigrants from Iraq are Kenyan (12.5%, a difference of 0.13%), Immigrants from Cameroon (12.4%, a difference of 0.15%), Immigrants from Afghanistan (12.4%, a difference of 0.19%), Mongolian (12.4%, a difference of 0.34%), and Immigrants from Morocco (12.4%, a difference of 0.38%).
| Demographics | Rating | Rank | Poverty |
| Immigrants | Colombia | 47.7 /100 | #176 | Average 12.3% |
| Immigrants | Syria | 47.5 /100 | #177 | Average 12.3% |
| Uruguayans | 44.7 /100 | #178 | Average 12.4% |
| Immigrants | Morocco | 44.0 /100 | #179 | Average 12.4% |
| Mongolians | 43.6 /100 | #180 | Average 12.4% |
| Immigrants | Afghanistan | 42.1 /100 | #181 | Average 12.4% |
| Immigrants | Cameroon | 41.7 /100 | #182 | Average 12.4% |
| Immigrants | Iraq | 40.2 /100 | #183 | Average 12.4% |
| Kenyans | 38.8 /100 | #184 | Fair 12.5% |
| Israelis | 36.4 /100 | #185 | Fair 12.5% |
| Immigrants | Sierra Leone | 36.3 /100 | #186 | Fair 12.5% |
| Hawaiians | 34.1 /100 | #187 | Fair 12.5% |
| Immigrants | Costa Rica | 33.3 /100 | #188 | Fair 12.5% |
| Aleuts | 33.2 /100 | #189 | Fair 12.5% |
| Immigrants | South America | 32.3 /100 | #190 | Fair 12.5% |
Demographics Similar to Immigrants from Bolivia by Poverty
In terms of poverty, the demographic groups most similar to Immigrants from Bolivia are Bolivian (10.4%, a difference of 0.010%), Immigrants from Hong Kong (10.4%, a difference of 0.31%), Lithuanian (10.5%, a difference of 0.31%), Bhutanese (10.4%, a difference of 0.53%), and Norwegian (10.5%, a difference of 0.68%).
| Demographics | Rating | Rank | Poverty |
| Filipinos | 99.9 /100 | #7 | Exceptional 10.1% |
| Maltese | 99.9 /100 | #8 | Exceptional 10.2% |
| Immigrants | South Central Asia | 99.9 /100 | #9 | Exceptional 10.2% |
| Bulgarians | 99.9 /100 | #10 | Exceptional 10.2% |
| Immigrants | Lithuania | 99.9 /100 | #11 | Exceptional 10.3% |
| Bhutanese | 99.8 /100 | #12 | Exceptional 10.4% |
| Immigrants | Hong Kong | 99.8 /100 | #13 | Exceptional 10.4% |
| Immigrants | Bolivia | 99.8 /100 | #14 | Exceptional 10.4% |
| Bolivians | 99.8 /100 | #15 | Exceptional 10.4% |
| Lithuanians | 99.8 /100 | #16 | Exceptional 10.5% |
| Norwegians | 99.8 /100 | #17 | Exceptional 10.5% |
| Latvians | 99.8 /100 | #18 | Exceptional 10.5% |
| Immigrants | Scotland | 99.7 /100 | #19 | Exceptional 10.6% |
| Immigrants | North Macedonia | 99.7 /100 | #20 | Exceptional 10.6% |
| Luxembourgers | 99.7 /100 | #21 | Exceptional 10.6% |