Immigrants from Iraq vs Immigrants from Bangladesh Poverty
COMPARE
Immigrants from Iraq
Immigrants from Bangladesh
Poverty
Poverty Comparison
Immigrants from Iraq
Immigrants from Bangladesh
12.4%
POVERTY
40.2/ 100
METRIC RATING
183rd/ 347
METRIC RANK
15.3%
POVERTY
0.0/ 100
METRIC RATING
297th/ 347
METRIC RANK
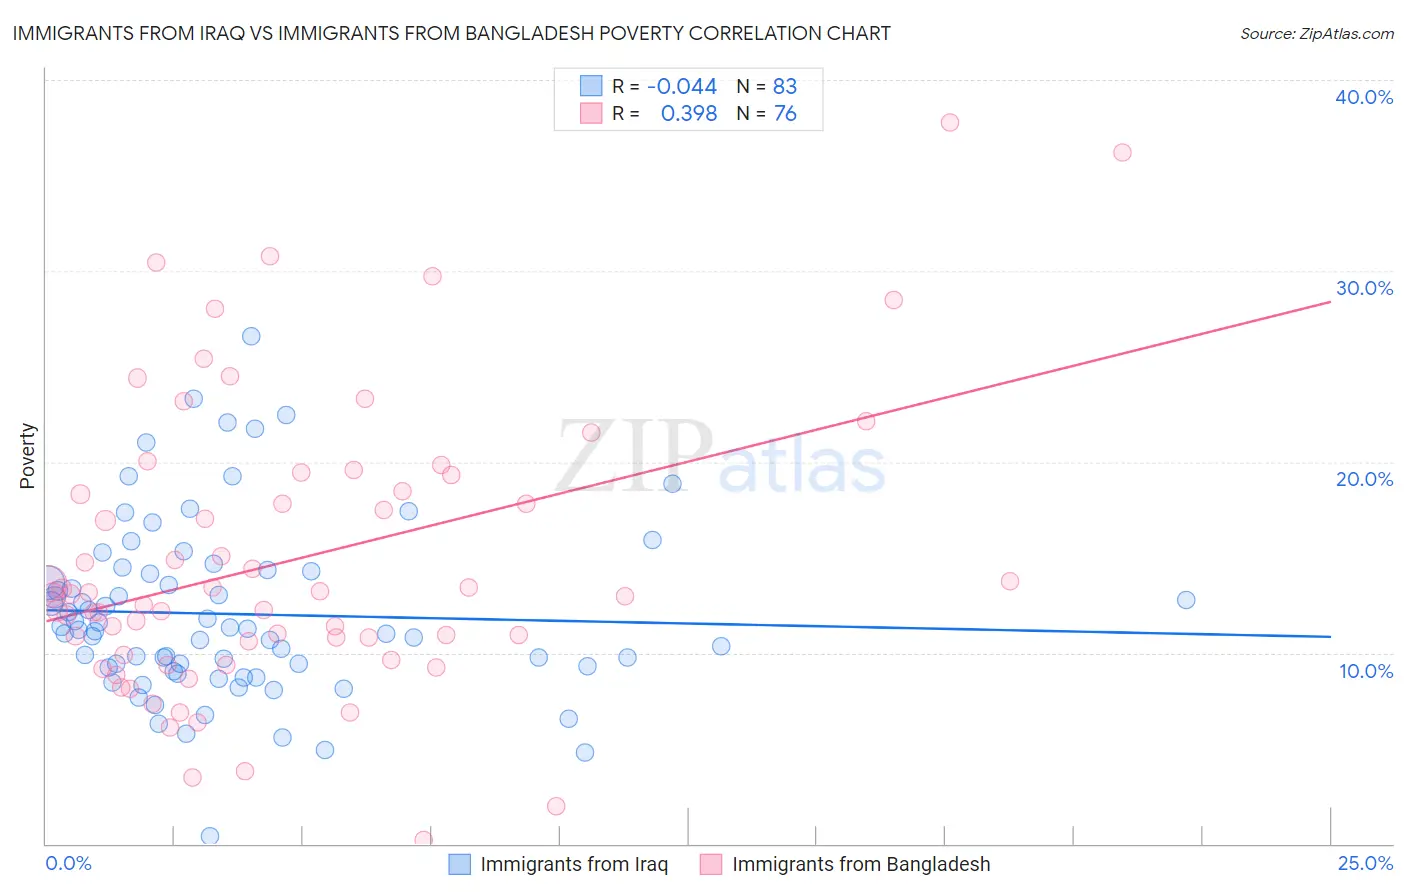
Immigrants from Iraq vs Immigrants from Bangladesh Poverty Correlation Chart
The statistical analysis conducted on geographies consisting of 194,714,900 people shows no correlation between the proportion of Immigrants from Iraq and poverty level in the United States with a correlation coefficient (R) of -0.044 and weighted average of 12.4%. Similarly, the statistical analysis conducted on geographies consisting of 203,580,134 people shows a mild positive correlation between the proportion of Immigrants from Bangladesh and poverty level in the United States with a correlation coefficient (R) of 0.398 and weighted average of 15.3%, a difference of 22.8%.
Poverty Correlation Summary
| Measurement | Immigrants from Iraq | Immigrants from Bangladesh |
| Minimum | 0.40% | 0.18% |
| Maximum | 26.6% | 37.7% |
| Range | 26.2% | 37.6% |
| Mean | 12.0% | 14.9% |
| Median | 11.2% | 13.1% |
| Interquartile 25% (IQ1) | 9.3% | 10.2% |
| Interquartile 75% (IQ3) | 14.3% | 18.9% |
| Interquartile Range (IQR) | 5.0% | 8.6% |
| Standard Deviation (Sample) | 4.6% | 7.6% |
| Standard Deviation (Population) | 4.6% | 7.5% |
Similar Demographics by Poverty
Demographics Similar to Immigrants from Iraq by Poverty
In terms of poverty, the demographic groups most similar to Immigrants from Iraq are Kenyan (12.5%, a difference of 0.13%), Immigrants from Cameroon (12.4%, a difference of 0.15%), Immigrants from Afghanistan (12.4%, a difference of 0.19%), Mongolian (12.4%, a difference of 0.34%), and Immigrants from Morocco (12.4%, a difference of 0.38%).
| Demographics | Rating | Rank | Poverty |
| Immigrants | Colombia | 47.7 /100 | #176 | Average 12.3% |
| Immigrants | Syria | 47.5 /100 | #177 | Average 12.3% |
| Uruguayans | 44.7 /100 | #178 | Average 12.4% |
| Immigrants | Morocco | 44.0 /100 | #179 | Average 12.4% |
| Mongolians | 43.6 /100 | #180 | Average 12.4% |
| Immigrants | Afghanistan | 42.1 /100 | #181 | Average 12.4% |
| Immigrants | Cameroon | 41.7 /100 | #182 | Average 12.4% |
| Immigrants | Iraq | 40.2 /100 | #183 | Average 12.4% |
| Kenyans | 38.8 /100 | #184 | Fair 12.5% |
| Israelis | 36.4 /100 | #185 | Fair 12.5% |
| Immigrants | Sierra Leone | 36.3 /100 | #186 | Fair 12.5% |
| Hawaiians | 34.1 /100 | #187 | Fair 12.5% |
| Immigrants | Costa Rica | 33.3 /100 | #188 | Fair 12.5% |
| Aleuts | 33.2 /100 | #189 | Fair 12.5% |
| Immigrants | South America | 32.3 /100 | #190 | Fair 12.5% |
Demographics Similar to Immigrants from Bangladesh by Poverty
In terms of poverty, the demographic groups most similar to Immigrants from Bangladesh are Guatemalan (15.3%, a difference of 0.050%), Hispanic or Latino (15.3%, a difference of 0.050%), Immigrants from Senegal (15.3%, a difference of 0.15%), Senegalese (15.3%, a difference of 0.24%), and Blackfeet (15.2%, a difference of 0.47%).
| Demographics | Rating | Rank | Poverty |
| Mexicans | 0.0 /100 | #290 | Tragic 15.1% |
| Immigrants | Cabo Verde | 0.0 /100 | #291 | Tragic 15.1% |
| Indonesians | 0.0 /100 | #292 | Tragic 15.1% |
| Immigrants | Zaire | 0.0 /100 | #293 | Tragic 15.1% |
| Blackfeet | 0.0 /100 | #294 | Tragic 15.2% |
| Guatemalans | 0.0 /100 | #295 | Tragic 15.3% |
| Hispanics or Latinos | 0.0 /100 | #296 | Tragic 15.3% |
| Immigrants | Bangladesh | 0.0 /100 | #297 | Tragic 15.3% |
| Immigrants | Senegal | 0.0 /100 | #298 | Tragic 15.3% |
| Senegalese | 0.0 /100 | #299 | Tragic 15.3% |
| Immigrants | Central America | 0.0 /100 | #300 | Tragic 15.4% |
| Bahamians | 0.0 /100 | #301 | Tragic 15.4% |
| Somalis | 0.0 /100 | #302 | Tragic 15.4% |
| Immigrants | Caribbean | 0.0 /100 | #303 | Tragic 15.5% |
| Immigrants | Mexico | 0.0 /100 | #304 | Tragic 15.5% |