Immigrants from India vs Black/African American Male Poverty
COMPARE
Immigrants from India
Black/African American
Male Poverty
Male Poverty Comparison
Immigrants from India
Blacks/African Americans
8.2%
MALE POVERTY
100.0/ 100
METRIC RATING
1st/ 347
METRIC RANK
15.8%
MALE POVERTY
0.0/ 100
METRIC RATING
328th/ 347
METRIC RANK
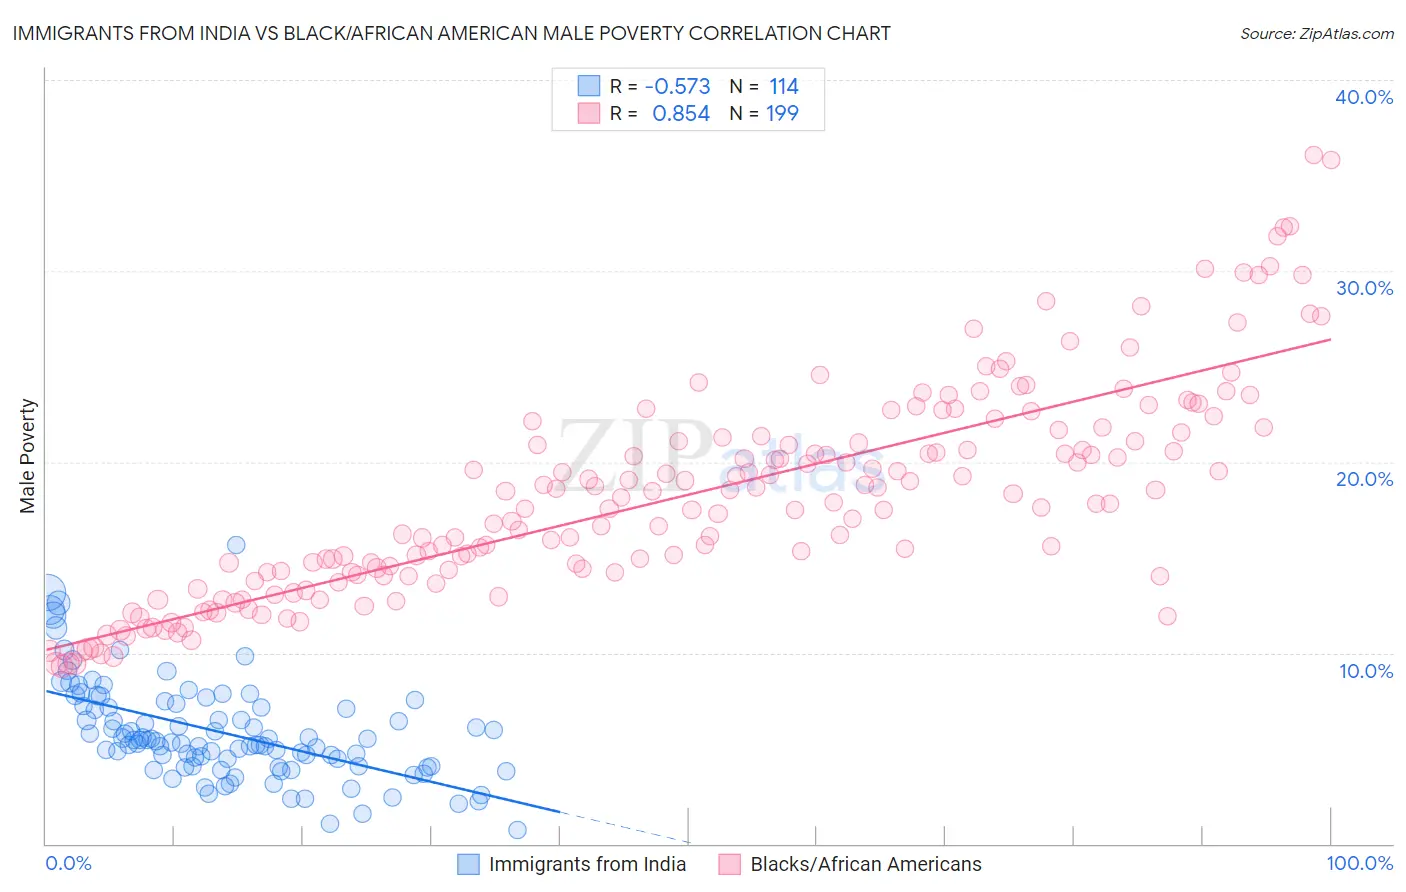
Immigrants from India vs Black/African American Male Poverty Correlation Chart
The statistical analysis conducted on geographies consisting of 433,533,379 people shows a substantial negative correlation between the proportion of Immigrants from India and poverty level among males in the United States with a correlation coefficient (R) of -0.573 and weighted average of 8.2%. Similarly, the statistical analysis conducted on geographies consisting of 564,646,557 people shows a very strong positive correlation between the proportion of Blacks/African Americans and poverty level among males in the United States with a correlation coefficient (R) of 0.854 and weighted average of 15.8%, a difference of 93.2%.
Male Poverty Correlation Summary
| Measurement | Immigrants from India | Black/African American |
| Minimum | 0.74% | 9.3% |
| Maximum | 15.6% | 36.0% |
| Range | 14.9% | 26.8% |
| Mean | 5.8% | 18.2% |
| Median | 5.4% | 17.9% |
| Interquartile 25% (IQ1) | 4.1% | 14.2% |
| Interquartile 75% (IQ3) | 7.2% | 21.3% |
| Interquartile Range (IQR) | 3.2% | 7.1% |
| Standard Deviation (Sample) | 2.6% | 5.5% |
| Standard Deviation (Population) | 2.6% | 5.5% |
Similar Demographics by Male Poverty
Demographics Similar to Immigrants from India by Male Poverty
In terms of male poverty, the demographic groups most similar to Immigrants from India are Chinese (8.7%, a difference of 6.2%), Thai (8.7%, a difference of 6.2%), Immigrants from Taiwan (8.9%, a difference of 8.7%), Maltese (9.1%, a difference of 10.9%), and Assyrian/Chaldean/Syriac (9.1%, a difference of 11.6%).
| Demographics | Rating | Rank | Male Poverty |
| Immigrants | India | 100.0 /100 | #1 | Exceptional 8.2% |
| Chinese | 100.0 /100 | #2 | Exceptional 8.7% |
| Thais | 100.0 /100 | #3 | Exceptional 8.7% |
| Immigrants | Taiwan | 100.0 /100 | #4 | Exceptional 8.9% |
| Maltese | 100.0 /100 | #5 | Exceptional 9.1% |
| Assyrians/Chaldeans/Syriacs | 99.9 /100 | #6 | Exceptional 9.1% |
| Immigrants | Ireland | 99.9 /100 | #7 | Exceptional 9.1% |
| Filipinos | 99.9 /100 | #8 | Exceptional 9.2% |
| Immigrants | South Central Asia | 99.9 /100 | #9 | Exceptional 9.3% |
| Bulgarians | 99.9 /100 | #10 | Exceptional 9.3% |
| Bolivians | 99.9 /100 | #11 | Exceptional 9.4% |
| Immigrants | Bolivia | 99.9 /100 | #12 | Exceptional 9.4% |
| Immigrants | Lithuania | 99.9 /100 | #13 | Exceptional 9.4% |
| Immigrants | North Macedonia | 99.8 /100 | #14 | Exceptional 9.4% |
| Bhutanese | 99.8 /100 | #15 | Exceptional 9.5% |
Demographics Similar to Blacks/African Americans by Male Poverty
In terms of male poverty, the demographic groups most similar to Blacks/African Americans are Paiute (15.8%, a difference of 0.060%), Dominican (16.1%, a difference of 1.7%), Immigrants from Dominican Republic (16.2%, a difference of 2.4%), Ute (16.2%, a difference of 2.7%), and Central American Indian (15.3%, a difference of 3.2%).
| Demographics | Rating | Rank | Male Poverty |
| Arapaho | 0.0 /100 | #321 | Tragic 15.1% |
| Kiowa | 0.0 /100 | #322 | Tragic 15.2% |
| Colville | 0.0 /100 | #323 | Tragic 15.2% |
| Menominee | 0.0 /100 | #324 | Tragic 15.3% |
| Yakama | 0.0 /100 | #325 | Tragic 15.3% |
| Central American Indians | 0.0 /100 | #326 | Tragic 15.3% |
| Paiute | 0.0 /100 | #327 | Tragic 15.8% |
| Blacks/African Americans | 0.0 /100 | #328 | Tragic 15.8% |
| Dominicans | 0.0 /100 | #329 | Tragic 16.1% |
| Immigrants | Dominican Republic | 0.0 /100 | #330 | Tragic 16.2% |
| Ute | 0.0 /100 | #331 | Tragic 16.2% |
| Houma | 0.0 /100 | #332 | Tragic 16.7% |
| Natives/Alaskans | 0.0 /100 | #333 | Tragic 16.9% |
| Cheyenne | 0.0 /100 | #334 | Tragic 17.6% |
| Apache | 0.0 /100 | #335 | Tragic 17.7% |