Immigrants from Haiti vs Hispanic or Latino Female Poverty
COMPARE
Immigrants from Haiti
Hispanic or Latino
Female Poverty
Female Poverty Comparison
Immigrants from Haiti
Hispanics or Latinos
16.1%
FEMALE POVERTY
0.0/ 100
METRIC RATING
282nd/ 347
METRIC RANK
16.6%
FEMALE POVERTY
0.0/ 100
METRIC RATING
299th/ 347
METRIC RANK
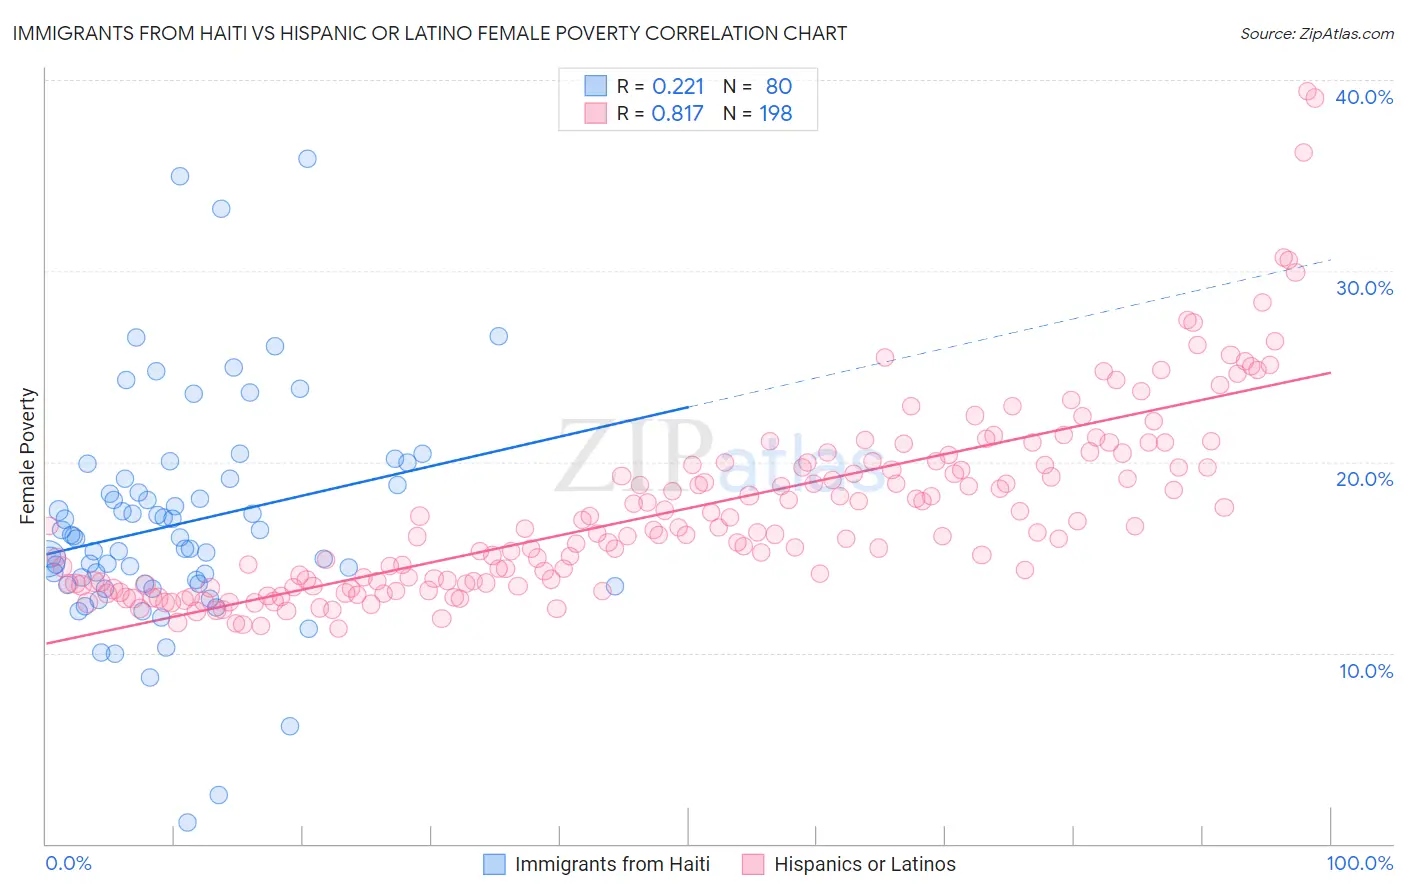
Immigrants from Haiti vs Hispanic or Latino Female Poverty Correlation Chart
The statistical analysis conducted on geographies consisting of 225,156,546 people shows a weak positive correlation between the proportion of Immigrants from Haiti and poverty level among females in the United States with a correlation coefficient (R) of 0.221 and weighted average of 16.1%. Similarly, the statistical analysis conducted on geographies consisting of 574,030,648 people shows a very strong positive correlation between the proportion of Hispanics or Latinos and poverty level among females in the United States with a correlation coefficient (R) of 0.817 and weighted average of 16.6%, a difference of 3.1%.
Female Poverty Correlation Summary
| Measurement | Immigrants from Haiti | Hispanic or Latino |
| Minimum | 1.1% | 11.3% |
| Maximum | 35.8% | 39.4% |
| Range | 34.7% | 28.1% |
| Mean | 16.8% | 17.5% |
| Median | 16.0% | 16.3% |
| Interquartile 25% (IQ1) | 13.6% | 13.6% |
| Interquartile 75% (IQ3) | 19.0% | 19.8% |
| Interquartile Range (IQR) | 5.3% | 6.2% |
| Standard Deviation (Sample) | 5.9% | 5.0% |
| Standard Deviation (Population) | 5.9% | 5.0% |
Demographics Similar to Immigrants from Haiti and Hispanics or Latinos by Female Poverty
In terms of female poverty, the demographic groups most similar to Immigrants from Haiti are Immigrants from Cuba (16.1%, a difference of 0.080%), Spanish American (16.2%, a difference of 0.13%), West Indian (16.1%, a difference of 0.15%), Vietnamese (16.1%, a difference of 0.17%), and Comanche (16.2%, a difference of 0.21%). Similarly, the demographic groups most similar to Hispanics or Latinos are Bahamian (16.6%, a difference of 0.040%), Somali (16.6%, a difference of 0.52%), Mexican (16.5%, a difference of 0.73%), Immigrants from Senegal (16.5%, a difference of 1.1%), and Senegalese (16.5%, a difference of 1.1%).
| Demographics | Rating | Rank | Female Poverty |
| Vietnamese | 0.0 /100 | #280 | Tragic 16.1% |
| West Indians | 0.0 /100 | #281 | Tragic 16.1% |
| Immigrants | Haiti | 0.0 /100 | #282 | Tragic 16.1% |
| Immigrants | Cuba | 0.0 /100 | #283 | Tragic 16.1% |
| Spanish Americans | 0.0 /100 | #284 | Tragic 16.2% |
| Comanche | 0.0 /100 | #285 | Tragic 16.2% |
| Inupiat | 0.0 /100 | #286 | Tragic 16.2% |
| Immigrants | Belize | 0.0 /100 | #287 | Tragic 16.3% |
| Indonesians | 0.0 /100 | #288 | Tragic 16.4% |
| Blackfeet | 0.0 /100 | #289 | Tragic 16.4% |
| Immigrants | Bangladesh | 0.0 /100 | #290 | Tragic 16.4% |
| Yaqui | 0.0 /100 | #291 | Tragic 16.4% |
| Immigrants | Zaire | 0.0 /100 | #292 | Tragic 16.4% |
| Immigrants | Latin America | 0.0 /100 | #293 | Tragic 16.4% |
| Immigrants | Cabo Verde | 0.0 /100 | #294 | Tragic 16.4% |
| Senegalese | 0.0 /100 | #295 | Tragic 16.5% |
| Immigrants | Senegal | 0.0 /100 | #296 | Tragic 16.5% |
| Mexicans | 0.0 /100 | #297 | Tragic 16.5% |
| Somalis | 0.0 /100 | #298 | Tragic 16.6% |
| Hispanics or Latinos | 0.0 /100 | #299 | Tragic 16.6% |
| Bahamians | 0.0 /100 | #300 | Tragic 16.6% |