Immigrants from Haiti vs Polish Female Poverty
COMPARE
Immigrants from Haiti
Polish
Female Poverty
Female Poverty Comparison
Immigrants from Haiti
Poles
16.1%
FEMALE POVERTY
0.0/ 100
METRIC RATING
282nd/ 347
METRIC RANK
11.7%
FEMALE POVERTY
99.5/ 100
METRIC RATING
31st/ 347
METRIC RANK
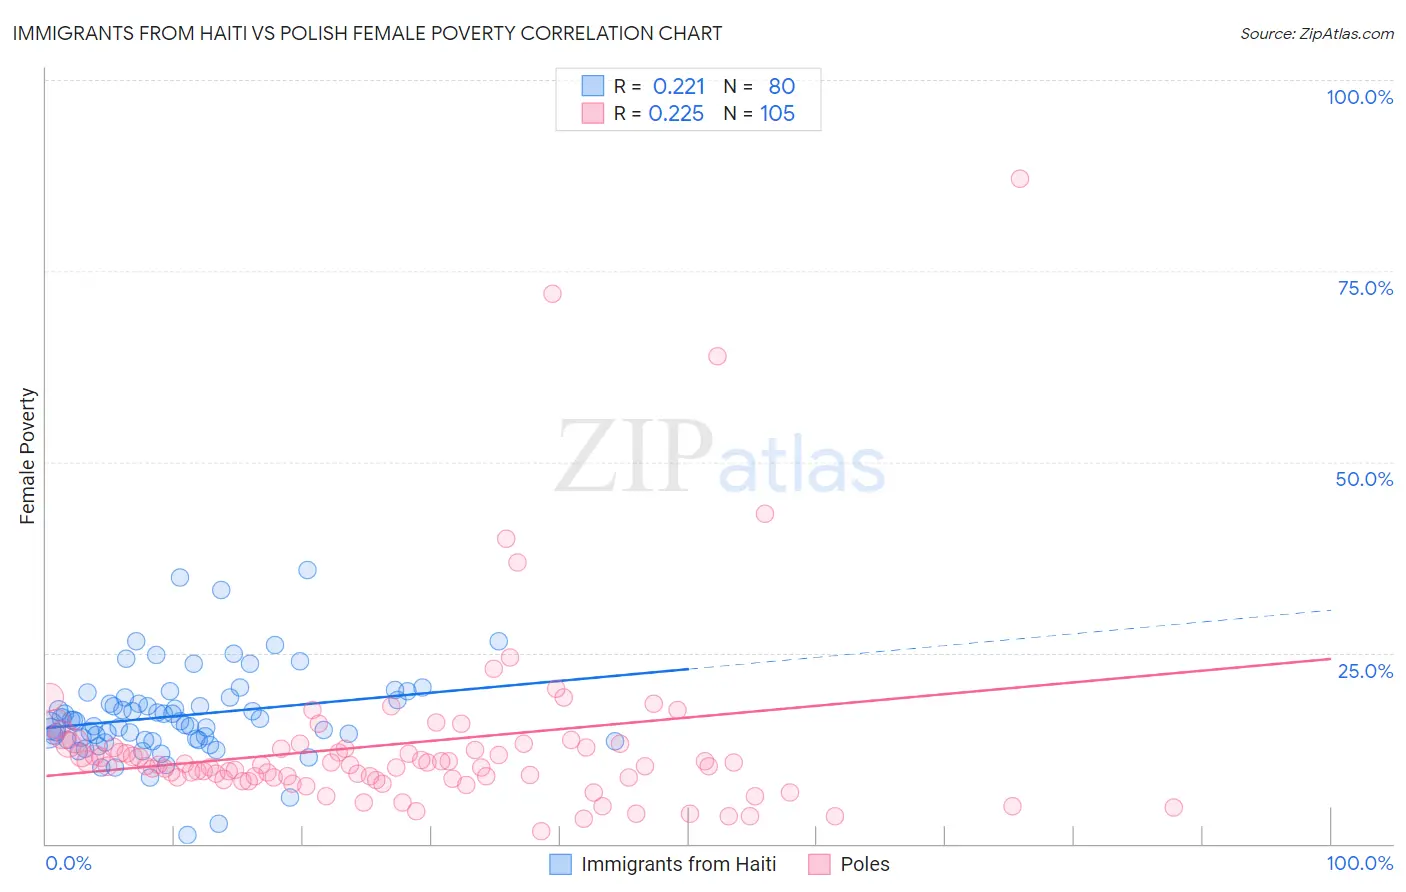
Immigrants from Haiti vs Polish Female Poverty Correlation Chart
The statistical analysis conducted on geographies consisting of 225,156,546 people shows a weak positive correlation between the proportion of Immigrants from Haiti and poverty level among females in the United States with a correlation coefficient (R) of 0.221 and weighted average of 16.1%. Similarly, the statistical analysis conducted on geographies consisting of 559,323,396 people shows a weak positive correlation between the proportion of Poles and poverty level among females in the United States with a correlation coefficient (R) of 0.225 and weighted average of 11.7%, a difference of 37.6%.
Female Poverty Correlation Summary
| Measurement | Immigrants from Haiti | Polish |
| Minimum | 1.1% | 1.6% |
| Maximum | 35.8% | 87.1% |
| Range | 34.7% | 85.5% |
| Mean | 16.8% | 13.1% |
| Median | 16.0% | 10.3% |
| Interquartile 25% (IQ1) | 13.6% | 8.6% |
| Interquartile 75% (IQ3) | 19.0% | 12.8% |
| Interquartile Range (IQR) | 5.3% | 4.3% |
| Standard Deviation (Sample) | 5.9% | 12.4% |
| Standard Deviation (Population) | 5.9% | 12.4% |
Similar Demographics by Female Poverty
Demographics Similar to Immigrants from Haiti by Female Poverty
In terms of female poverty, the demographic groups most similar to Immigrants from Haiti are Immigrants from Cuba (16.1%, a difference of 0.080%), Spanish American (16.2%, a difference of 0.13%), West Indian (16.1%, a difference of 0.15%), Vietnamese (16.1%, a difference of 0.17%), and Comanche (16.2%, a difference of 0.21%).
| Demographics | Rating | Rank | Female Poverty |
| Immigrants | Barbados | 0.0 /100 | #275 | Tragic 16.0% |
| Central Americans | 0.0 /100 | #276 | Tragic 16.0% |
| Bangladeshis | 0.0 /100 | #277 | Tragic 16.0% |
| Immigrants | West Indies | 0.0 /100 | #278 | Tragic 16.1% |
| Immigrants | Bahamas | 0.0 /100 | #279 | Tragic 16.1% |
| Vietnamese | 0.0 /100 | #280 | Tragic 16.1% |
| West Indians | 0.0 /100 | #281 | Tragic 16.1% |
| Immigrants | Haiti | 0.0 /100 | #282 | Tragic 16.1% |
| Immigrants | Cuba | 0.0 /100 | #283 | Tragic 16.1% |
| Spanish Americans | 0.0 /100 | #284 | Tragic 16.2% |
| Comanche | 0.0 /100 | #285 | Tragic 16.2% |
| Inupiat | 0.0 /100 | #286 | Tragic 16.2% |
| Immigrants | Belize | 0.0 /100 | #287 | Tragic 16.3% |
| Indonesians | 0.0 /100 | #288 | Tragic 16.4% |
| Blackfeet | 0.0 /100 | #289 | Tragic 16.4% |
Demographics Similar to Poles by Female Poverty
In terms of female poverty, the demographic groups most similar to Poles are Danish (11.7%, a difference of 0.13%), Cypriot (11.8%, a difference of 0.21%), Greek (11.7%, a difference of 0.22%), Immigrants from North Macedonia (11.7%, a difference of 0.30%), and Immigrants from Singapore (11.8%, a difference of 0.32%).
| Demographics | Rating | Rank | Female Poverty |
| Luxembourgers | 99.7 /100 | #24 | Exceptional 11.6% |
| Immigrants | Northern Europe | 99.6 /100 | #25 | Exceptional 11.6% |
| Croatians | 99.6 /100 | #26 | Exceptional 11.6% |
| Iranians | 99.6 /100 | #27 | Exceptional 11.7% |
| Immigrants | Korea | 99.6 /100 | #28 | Exceptional 11.7% |
| Immigrants | North Macedonia | 99.6 /100 | #29 | Exceptional 11.7% |
| Greeks | 99.5 /100 | #30 | Exceptional 11.7% |
| Poles | 99.5 /100 | #31 | Exceptional 11.7% |
| Danes | 99.5 /100 | #32 | Exceptional 11.7% |
| Cypriots | 99.5 /100 | #33 | Exceptional 11.8% |
| Immigrants | Singapore | 99.4 /100 | #34 | Exceptional 11.8% |
| Immigrants | Iran | 99.4 /100 | #35 | Exceptional 11.8% |
| Immigrants | Pakistan | 99.4 /100 | #36 | Exceptional 11.8% |
| Immigrants | Greece | 99.3 /100 | #37 | Exceptional 11.8% |
| Russians | 99.3 /100 | #38 | Exceptional 11.8% |