Immigrants from Guyana vs Laotian Female Poverty
COMPARE
Immigrants from Guyana
Laotian
Female Poverty
Female Poverty Comparison
Immigrants from Guyana
Laotians
15.6%
FEMALE POVERTY
0.1/ 100
METRIC RATING
260th/ 347
METRIC RANK
12.6%
FEMALE POVERTY
93.4/ 100
METRIC RATING
107th/ 347
METRIC RANK
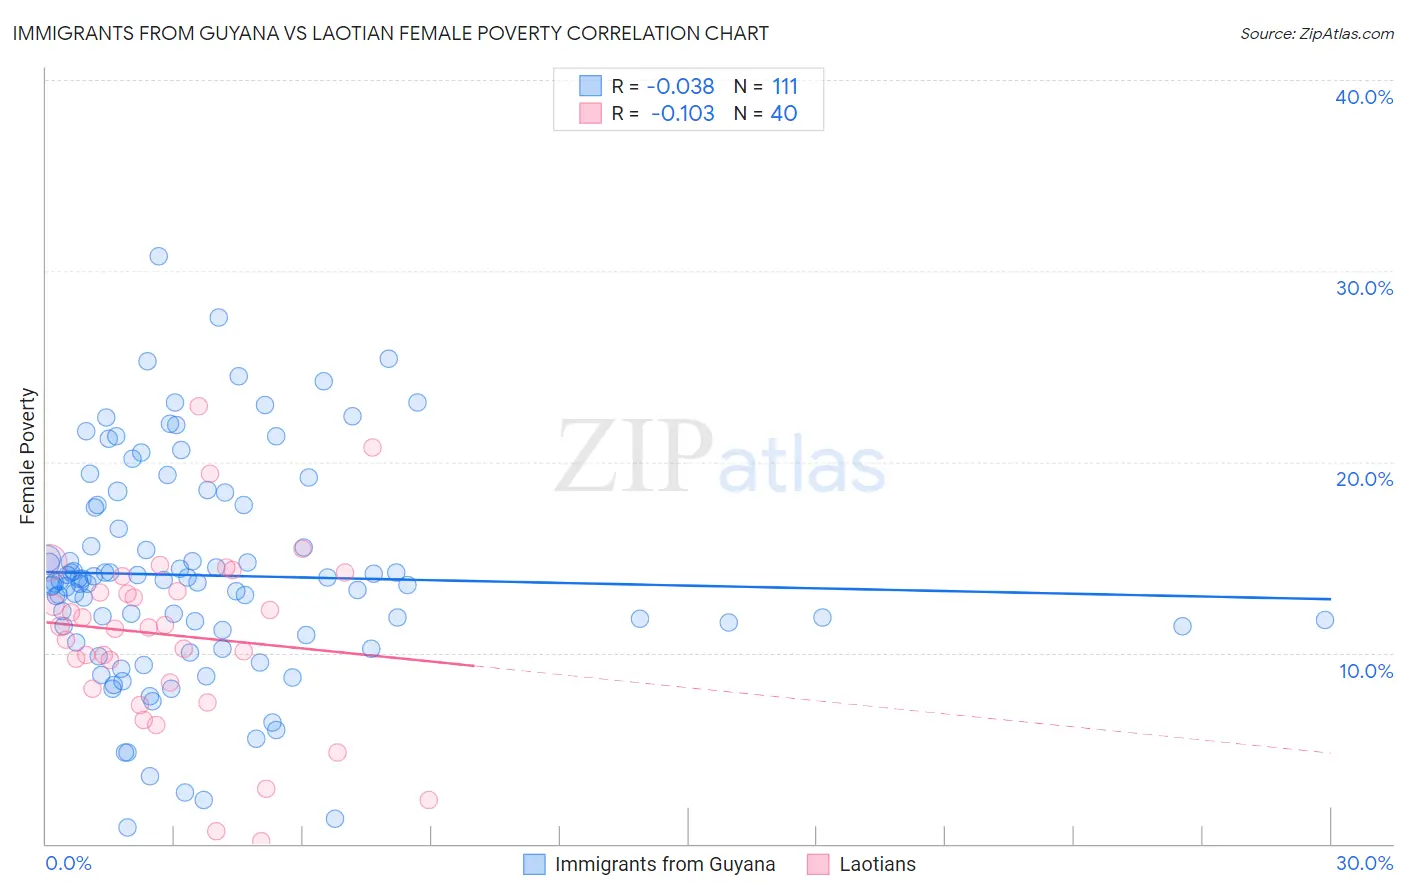
Immigrants from Guyana vs Laotian Female Poverty Correlation Chart
The statistical analysis conducted on geographies consisting of 183,633,406 people shows no correlation between the proportion of Immigrants from Guyana and poverty level among females in the United States with a correlation coefficient (R) of -0.038 and weighted average of 15.6%. Similarly, the statistical analysis conducted on geographies consisting of 224,727,554 people shows a poor negative correlation between the proportion of Laotians and poverty level among females in the United States with a correlation coefficient (R) of -0.103 and weighted average of 12.6%, a difference of 23.9%.
Female Poverty Correlation Summary
| Measurement | Immigrants from Guyana | Laotian |
| Minimum | 0.82% | 0.15% |
| Maximum | 30.8% | 22.9% |
| Range | 30.0% | 22.8% |
| Mean | 14.1% | 10.9% |
| Median | 13.7% | 11.4% |
| Interquartile 25% (IQ1) | 10.9% | 8.3% |
| Interquartile 75% (IQ3) | 17.7% | 13.6% |
| Interquartile Range (IQR) | 6.8% | 5.3% |
| Standard Deviation (Sample) | 5.7% | 4.8% |
| Standard Deviation (Population) | 5.7% | 4.8% |
Similar Demographics by Female Poverty
Demographics Similar to Immigrants from Guyana by Female Poverty
In terms of female poverty, the demographic groups most similar to Immigrants from Guyana are Cape Verdean (15.6%, a difference of 0.080%), Guyanese (15.6%, a difference of 0.10%), Mexican American Indian (15.6%, a difference of 0.10%), Cherokee (15.6%, a difference of 0.11%), and Shoshone (15.6%, a difference of 0.19%).
| Demographics | Rating | Rank | Female Poverty |
| Liberians | 0.2 /100 | #253 | Tragic 15.4% |
| Trinidadians and Tobagonians | 0.2 /100 | #254 | Tragic 15.4% |
| Ottawa | 0.2 /100 | #255 | Tragic 15.5% |
| Jamaicans | 0.2 /100 | #256 | Tragic 15.5% |
| Immigrants | Jamaica | 0.1 /100 | #257 | Tragic 15.6% |
| Shoshone | 0.1 /100 | #258 | Tragic 15.6% |
| Cape Verdeans | 0.1 /100 | #259 | Tragic 15.6% |
| Immigrants | Guyana | 0.1 /100 | #260 | Tragic 15.6% |
| Guyanese | 0.1 /100 | #261 | Tragic 15.6% |
| Mexican American Indians | 0.1 /100 | #262 | Tragic 15.6% |
| Cherokee | 0.1 /100 | #263 | Tragic 15.6% |
| Immigrants | Ecuador | 0.1 /100 | #264 | Tragic 15.6% |
| Immigrants | Liberia | 0.1 /100 | #265 | Tragic 15.7% |
| Immigrants | El Salvador | 0.1 /100 | #266 | Tragic 15.7% |
| Sub-Saharan Africans | 0.1 /100 | #267 | Tragic 15.8% |
Demographics Similar to Laotians by Female Poverty
In terms of female poverty, the demographic groups most similar to Laotians are Portuguese (12.6%, a difference of 0.10%), Immigrants from Zimbabwe (12.6%, a difference of 0.12%), Paraguayan (12.6%, a difference of 0.15%), Immigrants from Turkey (12.6%, a difference of 0.19%), and Scottish (12.5%, a difference of 0.31%).
| Demographics | Rating | Rank | Female Poverty |
| Immigrants | Latvia | 94.8 /100 | #100 | Exceptional 12.5% |
| Tlingit-Haida | 94.8 /100 | #101 | Exceptional 12.5% |
| Immigrants | China | 94.5 /100 | #102 | Exceptional 12.5% |
| Slavs | 94.5 /100 | #103 | Exceptional 12.5% |
| Palestinians | 94.3 /100 | #104 | Exceptional 12.5% |
| Scottish | 94.1 /100 | #105 | Exceptional 12.5% |
| Immigrants | Turkey | 93.8 /100 | #106 | Exceptional 12.6% |
| Laotians | 93.4 /100 | #107 | Exceptional 12.6% |
| Portuguese | 93.1 /100 | #108 | Exceptional 12.6% |
| Immigrants | Zimbabwe | 93.1 /100 | #109 | Exceptional 12.6% |
| Paraguayans | 93.0 /100 | #110 | Exceptional 12.6% |
| Soviet Union | 92.4 /100 | #111 | Exceptional 12.6% |
| Immigrants | Israel | 92.0 /100 | #112 | Exceptional 12.6% |
| Canadians | 92.0 /100 | #113 | Exceptional 12.7% |
| Welsh | 91.6 /100 | #114 | Exceptional 12.7% |