German vs Laotian Female Poverty
COMPARE
German
Laotian
Female Poverty
Female Poverty Comparison
Germans
Laotians
12.2%
FEMALE POVERTY
98.0/ 100
METRIC RATING
64th/ 347
METRIC RANK
12.6%
FEMALE POVERTY
93.4/ 100
METRIC RATING
107th/ 347
METRIC RANK
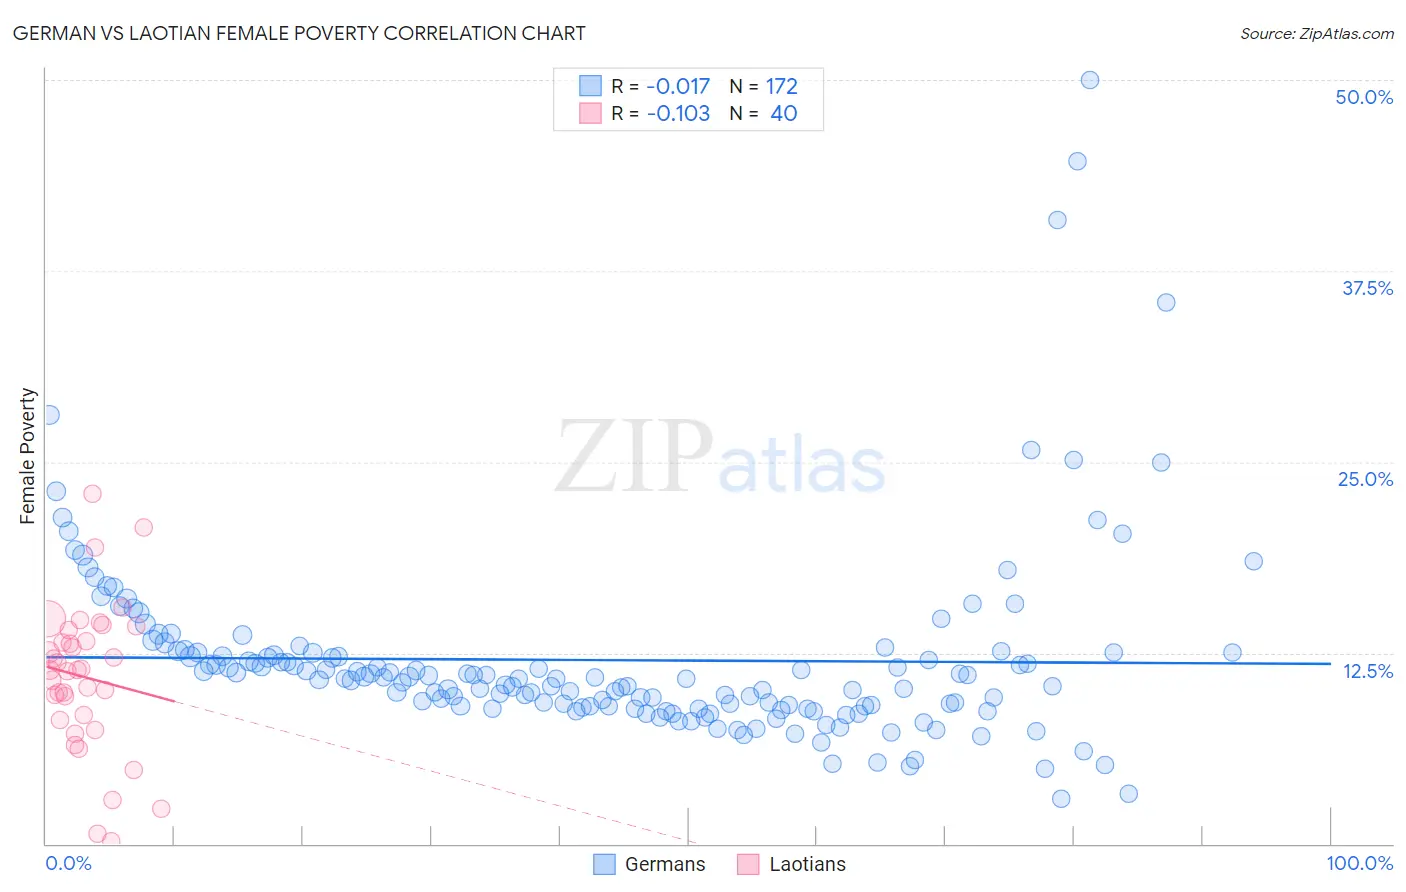
German vs Laotian Female Poverty Correlation Chart
The statistical analysis conducted on geographies consisting of 579,385,856 people shows no correlation between the proportion of Germans and poverty level among females in the United States with a correlation coefficient (R) of -0.017 and weighted average of 12.2%. Similarly, the statistical analysis conducted on geographies consisting of 224,727,554 people shows a poor negative correlation between the proportion of Laotians and poverty level among females in the United States with a correlation coefficient (R) of -0.103 and weighted average of 12.6%, a difference of 3.3%.
Female Poverty Correlation Summary
| Measurement | German | Laotian |
| Minimum | 2.9% | 0.15% |
| Maximum | 50.0% | 22.9% |
| Range | 47.1% | 22.8% |
| Mean | 12.0% | 10.9% |
| Median | 10.8% | 11.4% |
| Interquartile 25% (IQ1) | 9.0% | 8.3% |
| Interquartile 75% (IQ3) | 12.5% | 13.6% |
| Interquartile Range (IQR) | 3.5% | 5.3% |
| Standard Deviation (Sample) | 6.3% | 4.8% |
| Standard Deviation (Population) | 6.3% | 4.8% |
Similar Demographics by Female Poverty
Demographics Similar to Germans by Female Poverty
In terms of female poverty, the demographic groups most similar to Germans are Ukrainian (12.2%, a difference of 0.030%), Indian (Asian) (12.2%, a difference of 0.030%), Austrian (12.2%, a difference of 0.040%), Immigrants from Italy (12.2%, a difference of 0.11%), and Immigrants from Asia (12.2%, a difference of 0.13%).
| Demographics | Rating | Rank | Female Poverty |
| Immigrants | Serbia | 98.3 /100 | #57 | Exceptional 12.1% |
| Scandinavians | 98.2 /100 | #58 | Exceptional 12.1% |
| Immigrants | Europe | 98.2 /100 | #59 | Exceptional 12.1% |
| Immigrants | Australia | 98.1 /100 | #60 | Exceptional 12.2% |
| Immigrants | Asia | 98.1 /100 | #61 | Exceptional 12.2% |
| Immigrants | Italy | 98.0 /100 | #62 | Exceptional 12.2% |
| Ukrainians | 98.0 /100 | #63 | Exceptional 12.2% |
| Germans | 98.0 /100 | #64 | Exceptional 12.2% |
| Indians (Asian) | 97.9 /100 | #65 | Exceptional 12.2% |
| Austrians | 97.9 /100 | #66 | Exceptional 12.2% |
| Immigrants | Eastern Asia | 97.8 /100 | #67 | Exceptional 12.2% |
| Immigrants | Netherlands | 97.8 /100 | #68 | Exceptional 12.2% |
| Swiss | 97.7 /100 | #69 | Exceptional 12.2% |
| Immigrants | Belgium | 97.7 /100 | #70 | Exceptional 12.2% |
| Carpatho Rusyns | 97.6 /100 | #71 | Exceptional 12.2% |
Demographics Similar to Laotians by Female Poverty
In terms of female poverty, the demographic groups most similar to Laotians are Portuguese (12.6%, a difference of 0.10%), Immigrants from Zimbabwe (12.6%, a difference of 0.12%), Paraguayan (12.6%, a difference of 0.15%), Immigrants from Turkey (12.6%, a difference of 0.19%), and Scottish (12.5%, a difference of 0.31%).
| Demographics | Rating | Rank | Female Poverty |
| Immigrants | Latvia | 94.8 /100 | #100 | Exceptional 12.5% |
| Tlingit-Haida | 94.8 /100 | #101 | Exceptional 12.5% |
| Immigrants | China | 94.5 /100 | #102 | Exceptional 12.5% |
| Slavs | 94.5 /100 | #103 | Exceptional 12.5% |
| Palestinians | 94.3 /100 | #104 | Exceptional 12.5% |
| Scottish | 94.1 /100 | #105 | Exceptional 12.5% |
| Immigrants | Turkey | 93.8 /100 | #106 | Exceptional 12.6% |
| Laotians | 93.4 /100 | #107 | Exceptional 12.6% |
| Portuguese | 93.1 /100 | #108 | Exceptional 12.6% |
| Immigrants | Zimbabwe | 93.1 /100 | #109 | Exceptional 12.6% |
| Paraguayans | 93.0 /100 | #110 | Exceptional 12.6% |
| Soviet Union | 92.4 /100 | #111 | Exceptional 12.6% |
| Immigrants | Israel | 92.0 /100 | #112 | Exceptional 12.6% |
| Canadians | 92.0 /100 | #113 | Exceptional 12.7% |
| Welsh | 91.6 /100 | #114 | Exceptional 12.7% |